Technical Indicators
Overview
A technical indicator is a type of analysis chart that indicates market direction. Indicators generally overlay on price chart data to indicate where the price is going, or whether the price is in an "overbought" condition or an "oversold" condition.
AnyChart Stock Chart Component supports automatic building of several types of technical indicators. Technical indicators are based on data from data providers and do not depend on series.
This document lists available indicator types and gives directions to the tutorials about each indicator type and general information about technical indicators in AnyChart Stock Component.
![]()
General information
To understand how technical indicator gets data and what it depends on please study these documents:
![]()
Calculation Method
AnyChart Stock always calculates technical indicators values according to the data displayed on the chart at the given moment. It means you should keep in mind two things:
1. Data Grouping Level.
When you use Data Grouping indicators use grouped points and approximated values as the source data.
For example, if the source set contains daily date, but points are grouped into weeks - indicator is calculated by weeks, using values calculated according to approximation type settings.
If no data grouping is used - indicators are calculated from the original points and values.
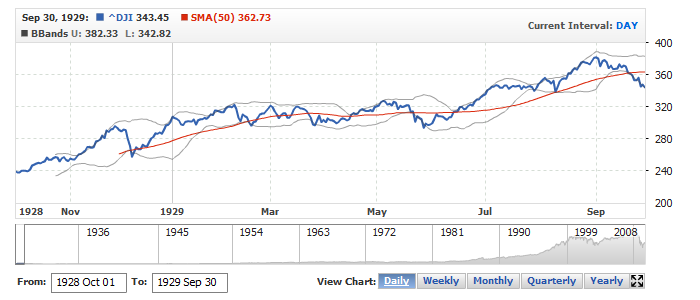
For better understanding take a look at the sample: daily data for a long period. Chart features two technical indicators: SMA(50) and BBands(20).
Use scroller and presets to zoom in and zoom out to see how indicators change:
2. Value Axis Scale Type.
Technical indicators work correct only for Values scale mode. If you use Changes or PercentChanges modes - indicators, just like series, show changes.
Live sample below shows to charts with technical indicators. First one uses Values scale mode, and the second one - Changes:
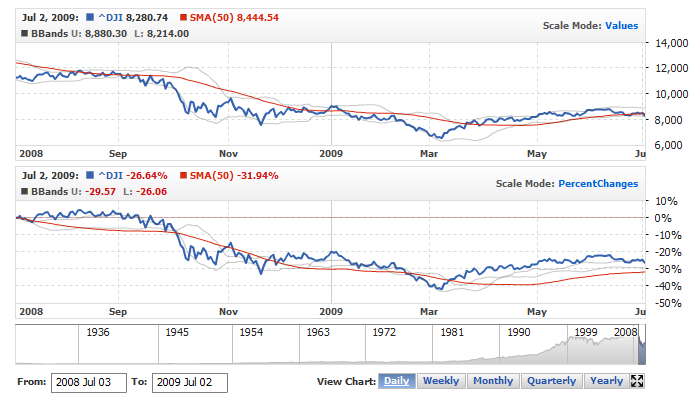
Caution: Use Changes and PercentChanges scale modes in indicators only if you clearly understand what does it mean and how this visualization type can be used.
Learn more about Value Axis Scale Modes at:
![]()
Supported Types
Table below lists supported technical indicators and links to the tutorials about each of them.
| Type | Tutorial |
|---|---|
| Accumulation Distribution Line (ADL) | |
| Adaptive Moving Average (AMA) | |
| Aroon | |
| Average True Range (ATR) | |
| Bollinger Bands (BBands) | |
| BBands %B | |
| BBands Width | |
| Commodity Channel Index (CCI) | |
| Chaikin Oscillator | |
| Chaikin Money Flow (CMF) | |
| Chaikin Volatility | |
| Directional Movement Index (DMI) | |
| Exponential Moving Average (EMA) | |
| Keltner Channels | |
| Modified Moving Average (MMA) | |
| Money Flow Index (MFI) | |
| Momentum | |
| Moving Average Convergence/Divergence (MACD) | |
| Moving Average Envelopes (MA Envelopes) | |
| On Balance Volume (OBV) | |
| Parabolic SAR (PSAR) | |
| Price Channels | |
| Rate of Change (ROC) | |
| Relative Strength Index (RSI) | |
| Simple Moving Average (SMA) | |
| Stochastic Oscillator (Fast,Slow) | |
| TRIX | |
| Volume | |
| Volume + MA | |
| Williams %R |
![]()
Mathematical Description
Mathematical description of all supported technical indicators can be studied at:
![]()