Modified Moving Average (MMA)
Overview
Modified Moving Average (MMA) is an algebraic tool, which makes averages more amenable to price shifts. This average comprises a sloping factor to help it overtake with the growing or declining value of the trading price of the currency.
Altered shifting averages resemble simple moving averages. The first point of the modified moving average is calculated precisely as the first point of the simple moving average is calculated. However, all following points are measured by adding the new price and afterwards subtracting from the resulting sum the last average.
AnyChart Stock allows you to add MMA with desired period to any of your charts.
Mathematical description of the indicator please see at: Mathematical Description of Technical Indicators

Adding indicator
To add any indicator to the chart, you need to use Data Provider with the fields required by the indicator.
When such Data Provider is ready - you can add indicator to the chart.
Preparing Data Provider
MMA indicator needs Data Provider with Value or Close fields.
Sample XML of Data Provider, which can be used to create MMA indicator:
In case if you use Data Provider for OHLC or Candlestick XML looks like that:
Indicator Declaration
As soon as Data Provider is ready you can add it to the chart.
MMA indicator is usually used as an Overlay indicator and displayed on the same chart with data series (stock data). So we should declare it in the chart where series is displayed.
XML for MMA declaration:
As you can see MMA type is set to indicator using type attribute, and data_provider attribute specifies Data Provider with series and indicator data.
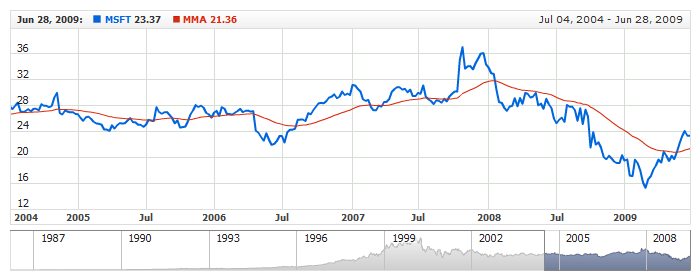
Live sample of the chart with MMA indicator:
Live Sample: Technical Indicators - Adding MMA to a Chart
Indicator parameters
Modified Moving Average Indicator has only one type specific parameter - period. Period is set in <mma_indicator> node, where all settings for MMA indicator are set.
XML for setting MMA period:
As you can see you just need to set period attribute in <mma_indicator> node, this attribute accepts any integer greater than 1.
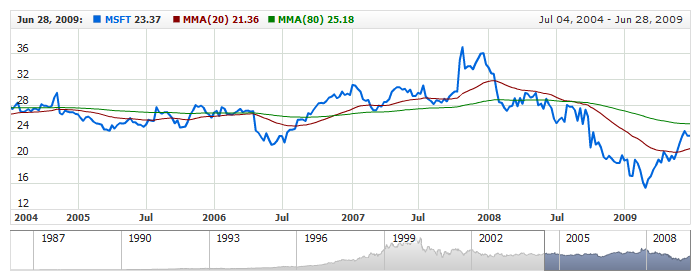
Live sample below shows two MMA: MMA(20) and MMA(80):
Live Sample: Technical Indicators - MMA Parameters
Visualization
To visualize and tune visualization of technical indicators AnyChart Stock Component uses the same methods as for the data series.
By default MMA is shown as series of Line type, but you can use almost any of available series types to show it on the chart - Spline, Area or Stick, for example.
MMA indicator settings are contained in <mma_indicator> node, also in this node you can put <series> subnode - this node defines how exactly indicator is displayed on the chart. This node is identical to <series> node used to describe data series, so you can do with indicator anything you can do with series.
Sample XML for changing indicator visualization:
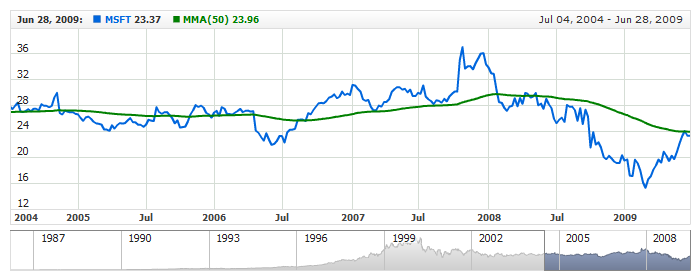
As you can see we set period, color, series type is set to Spline, line width is set to 2px, and name is set to "MMA(50)".
Live sample below shows settings described above:
Live Sample: Technical Indicators - MMA Visualization Settings
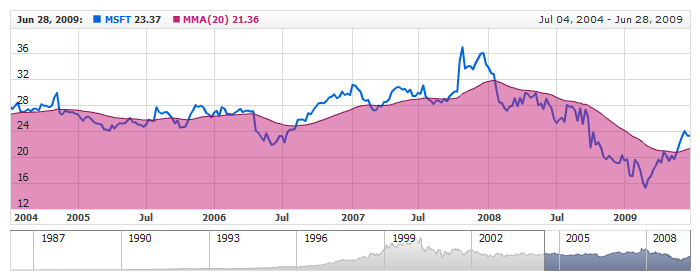
Another example of changing visualization of MMA indicator - it is shown as SplineArea:
Live Sample: Technical Indicators - Show MMA as SplineArea