Aroon Indicator

Overview

Developed by Tushar Chande in 1995, Aroon is an indicator system that determines whether a stock is trending or not and how strong the trend is. "Aroon" means "Dawn's Early Light" in Sanskrit. Chande chose this name because the indicators are designed to reveal the beginning of a new trend.

The Aroon indicators measure the number of periods since price recorded an x-day high or low. There are two separate indicators: Aroon-Up and Aroon-Down. A 25-day Aroon-Up measures the number of days since a 25-day high. A 25-day Aroon-Down measures the number of days since a 25-day low. In this sense, the Aroon indicators are quite different from typical momentum oscillators, which focus on price relative to time. Aroon is unique because it focuses on time relative to price. Chartists can use the Aroon indicators to spot emerging trends, identify consolidations, define correction periods and anticipate reversals.

Mathematical description of the indicator please see at: Mathematical Description of Technical Indicators

to top

Adding indicator

To add any indicator to the chart, you need to use Data Provider with the fields required by the indicator. When such Data Provider is ready - you can add indicator to the chart.

Preparing Data Provider

Aroon indicator needs data provider with High and Low fields.

Sample XML/JSON of Data Provider, which can be used to create Aroon indicator:

XML/JSON Syntax
Plain code
01 <?xml version="1.0" encoding="UTF-8"?>
02 <stock xmlns="http://anychart.com/products/stock/schemas/1.9.0/schema.xsd">
03   <data>
04     <data_providers>
05       <general_data_providers>
06         <data_provider data_set="dataSet1" id="dp1">
07           <fields>
08             <field type="High" column="2" approximation_type="High" />
09             <field type="Low" column="3" approximation_type="Low" />
10           </fields>
11         </data_provider>
12       </general_data_providers>
13     </data_providers>
14   </data>
15 </stock>
01{
02  data: {
03    dataProviders: {
04      generalDataProviders: [
05        {
06          dataSet: "dataSet1",
07          id: "dp1",
08          fields: [
09            {
10              type: "High",
11              column: 2,
12              approximationType: "High"
13            },
14            {
15              type: "Low",
16              column: 3,
17              approximationType: "Low"
18            }
19          ]
20        }
21      ]
22    }
23  }
24}

to top

Indicator Declaration

As soon as Data Provider is ready you can add an indicator to a chart.

Aroon indicator is usually shown on the chart above or below the chart with data (stock data). So we should declare it in another chart. Learn more about charts and layout in Chart Layout article.

XML/JSON for Aroon declaration, note that there are two charts defined - one is used to show the stock data, and another one contains technical indicator:

XML/JSON Syntax
Plain code
01 <?xml version="1.0" encoding="UTF-8"?>
02 <stock xmlns="http://anychart.com/products/stock/schemas/1.9.0/schema.xsd">
03   <settings>
04     <charts>
05       <chart>
06         <series_list>
07           <series type="Line" data_provider="dpMsft" />
08         </series_list>
09       </chart>
10       <chart>
11         <technical_indicators>
12           <technical_indicator type="Aroon" data_provider="dpMsft" />
13         </technical_indicators>
14       </chart>
15     </charts>
16   </settings>
17 </stock>
01{
02  settings: {
03    charts: [
04      {
05        seriesList: [
06          {
07            type: "Line",
08            dataProvider: "dpMsft"
09          }
10        ]
11      },
12      {
13        technicalIndicators: [
14          {
15            type: "Aroon",
16            dataProvider: "dpMsft"
17          }
18        ]
19      }
20    ]
21  }
22}

Another important thing is the fact that the Aroon indicator is shown in percentage terms and fluctuate between 0 and 100, so to show it properly we need to configure value axis scale in the chart with indicator, like that, for example:

XML/JSON Syntax
Plain code
01 <chart>
03     <technical_indicator type="Aroon" data_provider="dpMsft" />
05   <value_axes>
06     <primary>
07       <scale minimum_mode="CustomValue" minimum="-10" maximum_mode="CustomValue" maximum="110" interval_mode="CustomValue" interval="20" />
08     </primary>
09   </value_axes>
10 </chart>
01{
03    {
04      type: "Aroon",
05      dataProvider: "dpMsft"
06    }
07  ],
08  valueAxes: {
09    primary: {
10      scale: {
11        minimumMode: "CustomValue",
12        minimum: -10,
13        maximumMode: "CustomValue",
14        maximum: 110,
15        intervalMode: "CustomValue",
16        interval: 20
17      }
18    }
19  }
20}

Of course you can use other steps or margins, if you'd like to, as described in Y-Axes Settings article.

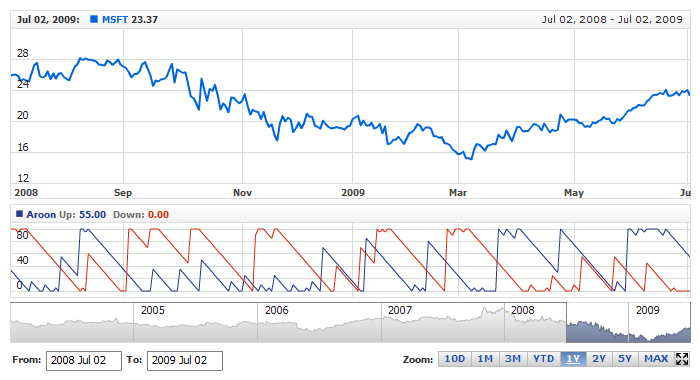
After all things mentioned above are done, you can create a chart with Aroon indicator, see basic Live Sample with it below:

Live Sample:  Technical Indicators - Adding Aroon Indicator

to top

Indicator parameters

Aroon indicator has only one type specific parameter - period. Period is set in <aroon_indicator> node, where all settings for Aroon indicator are set.

XML/JSON for setting Aroon period:

XML/JSON Syntax
Plain code
01 <chart>
03     <technical_indicator type="Aroon" data_provider="dpMsft">
04       <aroon_indicator period="25" />
05     </technical_indicator>
07 </chart>
01{
03    {
04      type: "Aroon",
05      dataProvider: "dpMsft",
06      aroonIndicator: {
07        period: 25
08      }
09    }
10  ]
11}

As you can see you just need to set period attribute in <aroon_indicator> node, this attribute accepts any integer greater than 1.

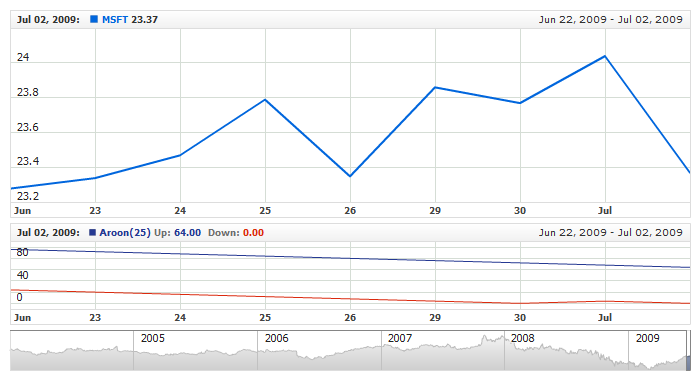
Live sample below shows Aroon(25):

Live Sample:  Technical Indicators - Aroon Parameters

to top

Visualization

To visualize and tune visualization of technical indicators AnyChart Stock Component uses the same methods as for the data series.

Aroon indicator settings are contained in <aroon_indicator> node, also in this node you can put two subnodes: <up_series> and <down_series> - these nodes define how exactly indicator is displayed on the chart. These nodes are identical to <series> node used to describe data series, so you can do with indicator anything you can do with series.

Sample XML/JSON for changing indicator visualization:

XML/JSON Syntax
Plain code
01 <chart>
03     <technical_indicator type="Aroon" data_provider="dpMsft">
04       <aroon_indicator period="25">
05         <up_series type="Line" color="#1b8d1b">
06           <name><![CDATA[Aroon(25)]]></name>
07           <line_series thickness="2" />
08         </up_series>
09         <down_series type="Line" color="#d01414">
10           <line_series thickness="2" />
11         </down_series>
12       </aroon_indicator>
13     </technical_indicator>
15 </chart>
01{
03    {
04      type: "Aroon",
05      dataProvider: "dpMsft",
06      aroonIndicator: {
07        period: 25,
08        upSeries: {
09          type: "Line",
10          color: "#1b8d1b",
11          name: "Aroon(25)",
12          lineSeries: {
13            thickness: 2
14          }
15        },
16        downSeries: {
17          type: "Line",
18          color: "#d01414",
19          lineSeries: {
20            thickness: 2
21          }
22        }
23      }
24    }
25  ]
26}

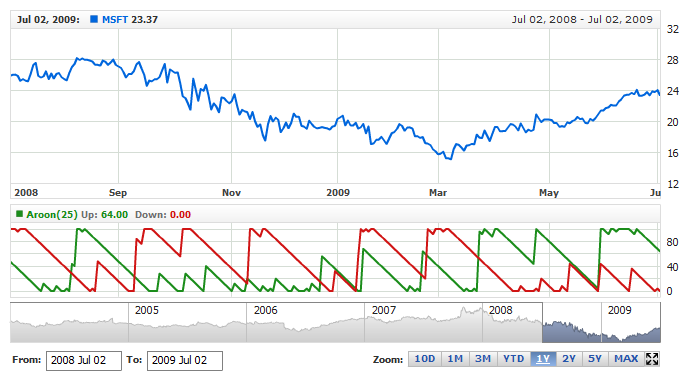
Live sample below shows settings shown above:

Live Sample:  Technical Indicators - Aroon Visualization Settings

to top