Commodity Channel Index (CCI)
Overview
Developed by Donald Lambert and featured in Commodities magazine in 1980, the Commodity Channel Index (CCI) is a versatile indicator that can be used to identify a new trend or warn of extreme conditions. Lambert originally developed CCI to identify cyclical turns in commodities, but the indicator can successfully applied to indices, ETFs, stocks and other securities. In general, CCI measures the current price level relative to an average price level over a given period of time. CCI is relatively high when prices are far above their average. CCI is relatively low when prices are far below their average. In this manner, CCI can be used to identify overbought and oversold levels.
Mathematical description of the indicator please see at: Mathematical Description of Technical Indicators

Adding indicator
To add any indicator to the chart, you need to use Data Provider with the fields required by the indicator.
When such Data Provider is ready - you can add indicator to the chart.
Preparing Data Provider
Commodity Channel Index indicator needs Data Provider with High, Low and Close or Value fields.
Sample XML/JSON of Data Provider, which can be used to create Commodity Channel Index indicator:
Indicator Declaration
As soon as Data Provider is ready you can add an indicator to a chart.
Commodity Channel Index indicator is usually
shown on the chart below the chart with data (stock data). So we should declare it in another chart. Learn more about charts and layout in Chart Layout article.
XML/JSON for Commodity Channel Index declaration, note that there are two charts defined - one is used to show the stock data, and another one contains technical
indicator:
01 |
<?xml version="1.0" encoding="UTF-8"?> |
02 |
<stock xmlns="http://anychart.com/products/stock/schemas/1.9.0/schema.xsd"> |
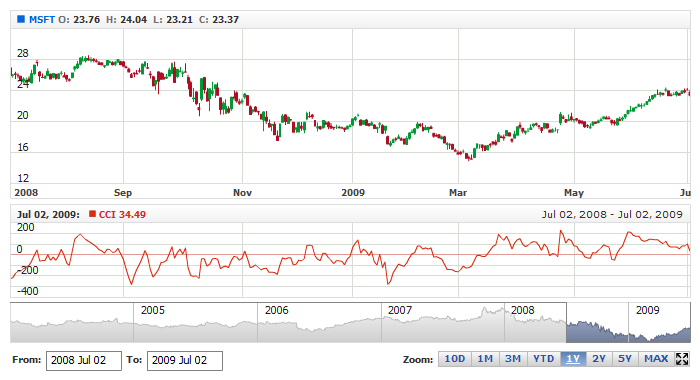
After all things mentioned above are done, you can create a chart with Commodity Channel Index indicator, see basic Live Sample with it below:
Live Sample: Technical Indicators - Adding Commodity Channel Index Indicator
Indicator parameters
Commodity Channel Index has one type-specific parameter - period.
This parameter is set in <cci_indicator> node, where all settings for Commodity Channel Index indicator are set.
XML for setting Commodity Channel Index parameters:
As you can see you just need to set period attribute in <cci_indicator> node, it accepts any integer greater than 1.
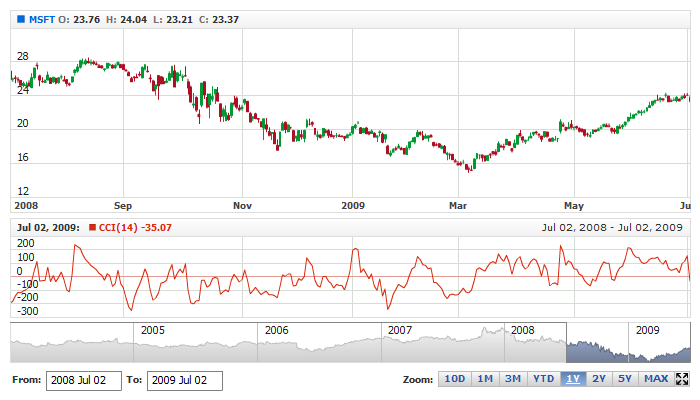
Live sample below shows sharpened CCI(14) indicator:
Live Sample: Technical Indicators - Commodity Channel Index Parameters
Visualization
To visualize and tune visualization of technical indicators AnyChart Stock Component uses the same methods as for
the data series.
By default Commodity Channel Index is shown as series of Line type, but you can use almost any of available series types to show it on
the chart - Spline, Area or Stick, for example.
Commodity Channel Index indicator settings are contained in <cci_indicator> node, also in this node you can
put <series> subnode - this node defines how exactly indicator is displayed on the chart. This node is
identical to <series> node used to describe data series, so you can do with indicator anything you can do
with series.
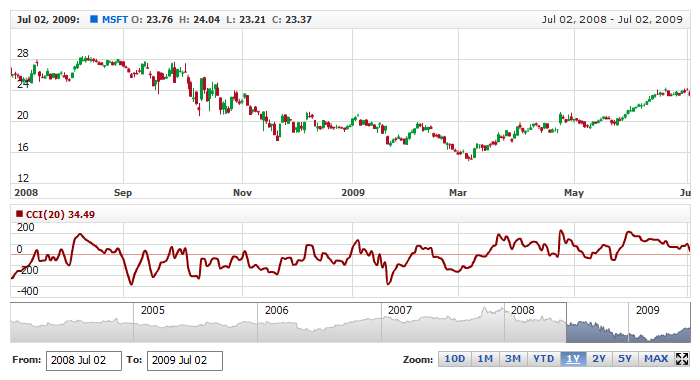
Sample XML for changing indicator visualization:
Live sample below shows settings shown above:
Live Sample: Technical Indicators - Commodity Channel Index Visualization Settings