Stochastic Oscillator (Fast, Slow and Full)
Overview
Stochastic oscillator is a momentum indicator used in technical analysis. Introduced by George Lane in the 1950s, it serves for comparing the closing price of a commodity to its price range over a given time span.
There are three subtypes of Stochastic Oscillator - Fast Stochastic, Slow Stochastic and Full Stochastic. AnyChart Stock allows adding only the Full Stochastic Indicator; however, you can use it to create the Fast and Slow subtypes as well.
The mathematical description of the indicator is available at: Mathematical Description of Technical Indicators

Adding Indicator
To add any indicator to the chart, you need to use Data Provider with the fields required by the indicator.
When such Data Provider is ready - you can add indicator to the chart.
Preparing Data Provider
Stochastic Oscillator indicator needs Data Provider with High, Low and Close fields.
Sample XML of Data Provider, which can be used to create Stochastic Oscillator indicator:
01 |
<?xml version="1.0" encoding="UTF-8"?> |
02 |
<stock xmlns="http://anychart.com/products/stock/schemas/1.9.0/schema.xsd"> |
Indicator Declaration
As soon as Data Provider is ready you can add an indicator to a chart.
Stochastic Oscillator is usually
shown on the chart below the chart with data (stock data). So we should declare it in another chart.
XML for Stochastic Oscillator declaration, note that there are two charts defined - one is used to show the stock data, and another one contains technical
indicator:
01 |
<?xml version="1.0" encoding="UTF-8"?> |
02 |
<stock xmlns="http://anychart.com/products/stock/schemas/1.9.0/schema.xsd"> |
15 | type: "StochasticOscillator", |
Another important thing is the fact that Stochastic Oscillator is measured on a 0 - 100 scale, so to show it properly we need to configure value axis scale in the chart with indicator, like that, for example:
04 | type: "StochasticOscillator", |
Of course you can use other steps or margins, if you'd like to, as described in Y-Axes Settings article.
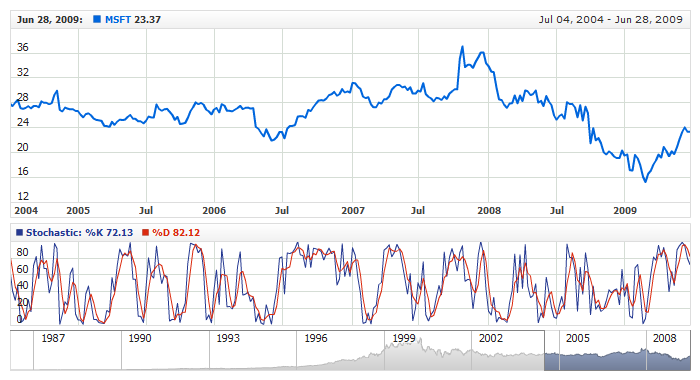
After all things mentioned above are done, you can create a chart with Stochastic Oscillator indicator, see basic Live Sample with it below:
Live Sample: Technical Indicators - Adding Stochastic Oscillator Indicator
Types and Parameters
As it has already been said in the overview, AnyChart Stock uses the Full Stochastic Oscillator indicator to draw the Full, Slow and Fast Oscillators. Use the power of the Full or limit it to the Slow or Fast - everything is under control.
The indicator parameters can be set in the <stochastic_oscillator_indicator> node. There are only four parameters, which are defined using the attributes listed below:
- %K Period - %K line calculation period; it is set in the k_period attribute and can be 1 or greater. The default value is 15.
- %D Period - %D line calculation period, which is calculated as MA to %K; it is set in the d_period attribute. This attribute must be greater than 1. The default value is 5.
- MA Type - moving average type for the calculation of %D; it is set in the ma_type attribute and can be either SMA or EMA. The default value is SMA.
- %K Smoothing Period - smoothing period for the original %K line values. This parameter is used for defining whether you are displaying the Fast, Slow or Full Stochastic indicator; it is set in the k_smoothing_period and can be 1 or greater. The default value is 1.
The sections below describe how to display any of the indicator subtypes along with the live samples for each of them.
Fast Stochastic
Fast Stochastic is the default indicator in AnyChart Stock StochasticOscillator, so you don't need to change anything in order to draw it. Having the %K smoothing period set to 1 means that no smoothing whatsoever is used.
To tune up the indicator in this case, you can change %K, %D and MA Type. Here is a sample XML for adding and configuring the Fast Stochastic indicator:
06 |
<name><![CDATA[Fast Stochastic: %K(14)]]></name> |
04 | type: "StochasticOscillator", |
11 | name: "Fast Stochastic: %K(14)" |
Here is a live sample for the Fast Stochastic indicator:
Live Sample: Technical Indicators - Fast Stochastic
Slow Stochastic
To display the Slow Stochastic, set k_smoothing_period to 3. All the other parameters can be altered. Here is a sample XML for adding and configuring the Slow Stochastic indicator:
06 |
<name><![CDATA[Slow Stochastic: %K(14)]]></name> |
04 | type: "StochasticOscillator", |
12 | name: "Slow Stochastic: %K(14)" |
Here is a live sample for the Slow Stochastic indicator:
Live Sample: Technical Indicators - Slow Stochastic
Full Stochastic
The Full Stochastic Oscillator differs from the Fast and the Slow by allowing you to select the %K smoothing period as you wish.
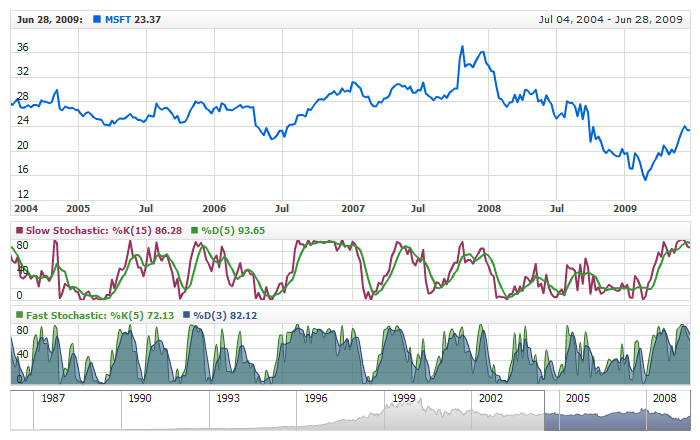
The live sample for the Full Stochastic with the %K smoothing period set to 10 is shown below; the Fast and Slow Stochastic are also added to the chart, so anyone can see the difference:
Live Sample: Technical Indicators - Full Stochastic
Visualization
To visualize and tune visualization of technical indicators AnyChart Stock Component uses the same methods as for
the data series.
By default Stochastic Oscillator is shown as series of Line types, but you can use almost any of available series types to show it on
the chart.
Stochastic Oscillator indicator settings are contained in <stochastic_oscillator_indicator> node,
also in this node you can put <k_series>, <d_series>
subnodes - these nodes define how exactly indicator is displayed on the chart. These nodes are
identical to <series> node used to describe data series, so you can do with indicator anything you can do
with series.
Sample XML for changing indicator visualization:
06 |
<name><![CDATA[Slow Stochastic: %K(15)]]></name> |
04 | type: "StochasticOscillator", |
12 | name: "Slow Stochastic: %K(15)", |
Live sample below shows how the look of indicator can be altered:
Live Sample: Technical Indicators - Stochastic Visualization Settings
Overbought/Oversold Visualization
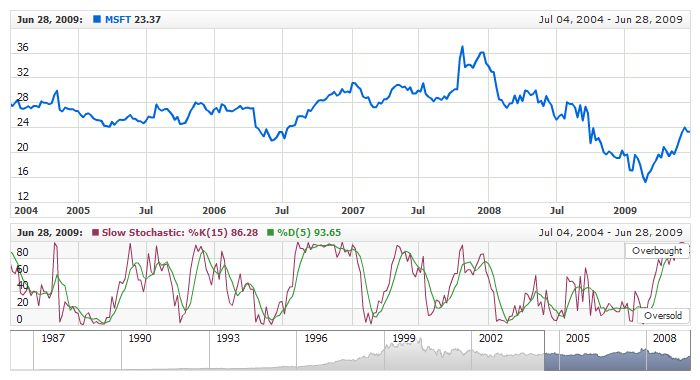
Stochastic Oscillator can be used to determine if there is too much or too little volume associated with a security. A stock is considered
"overbought" if the Stochastic Oscillator indicator reaches 80 and above, and if it is 20 and below it is suggested that a stock is "oversold".
To chart Overbought and Oversold signals in AnyChart Stock you can use Line or Range axis markers with labels, which are described in
Live sample below shows Stochastic Oscillator with labeled range axis markers used to highlight Overbought and Oversold signals:
Live Sample: Technical Indicators - Stochastic with Overbought and Oversold Signals