Mathematical Description of Technical Indicators
- Overview
- Accumulation Distribution Line (ADL)
- Adaptive Moving Average (AMA)
- Aroon
- Average True Range (ATR)
- Bollinger Bands (BBands)
- BBands %B
- BBands Width
- Commodity Channel Index (CCI)
- Chaikin Money Flow (CMF)
- Chaikin Oscillator (CHO)
- Chaikin Volatility (CHV)
- Directional Movement Indicator (DMI)
- Exponential Moving Average (EMA)
- Keltner Channels
- Modified (Smoothed) Moving Average (MMA)
- Money Flow Index (MFI)
- Momentum
- Moving Average Convergence/Divergence (MACD)
- Moving Average Envelopes (MA Envelopes)
- On Balance Volume (OBV)
- Parabolic SAR (PSAR)
- Price Channels
- Rate of Change (ROC)
- Relative Strength Index (RSI)
- Simple Moving Average (SMA)
- Stochastic Oscillator (Fast,Slow)
- TRIX
- Volume + MA
- Williams %R
Overview
This document contains mathematical description of all technical indicators available in AnyChart Stock Component.
For all formulas and indicators below:
- n is a period for which calculations are done, it is usually set by the period attribute in the indicator settings.
- Xi is the value passed by the data source.
![]()
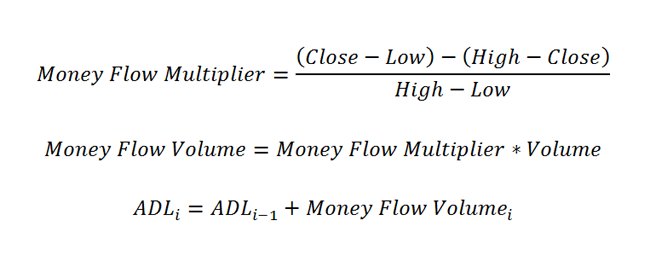
Accumulation Distribution Line (ADL)
Accumulation Distribution Line is calculated according to these formulas:
![]()
Adaptive Moving Average (AMA)
AMA overlay in each point is calculated according to the following calculation sequence:
- First, the ER value is calculated by this formula:
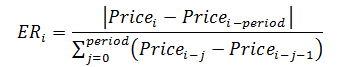
- Second, the SSC value is calculated by the next formula:
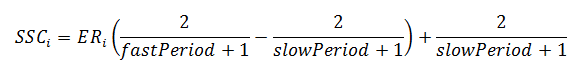
- And, finally, the AMA value is calculated like this:

![]()
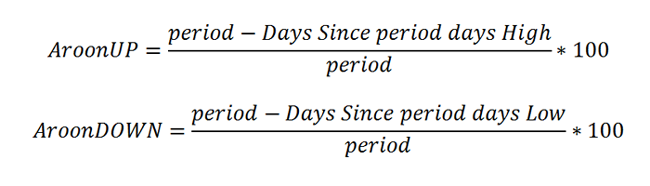
Aroon
Aroon indicator in each point is calculated according to the following formula:
![]()
Average True Range (ATR)
Average True Range in each point is calculated according to the following formula:
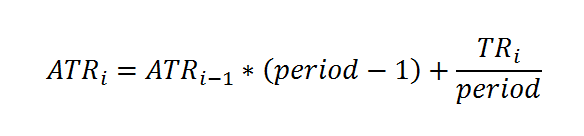
This formula is based on the True Range definition. TR is defined as the greatest of the following:
- Current High less the current Low,
- Current High less the previous Close (absolute value),
- Current Low less the previous Close (absolute value).
![]()
Bollinger Bands (BBands)
Bollinger Bands values in each point are calculated in three steps:
- SMAi is calculated according to Simple Moving Average formula.
- Standard deviation is calculated as:
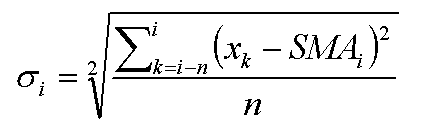
- Bollinger Bands values are calculated according to this formula, where d is set using deviation attribute in <bbands_indicator> node:
![]()
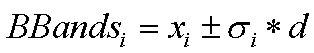
BBands %B
Bollinger Bands %B indicator is calculated according to this formula:
You can see how Bollinger Upper and Lower Bands are calculated in the BBands part of this article.
![]()
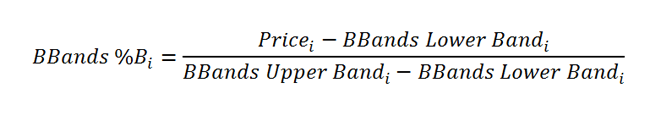
BBands Width
Bollinger Bands Width indicator is calculated according to this formula:
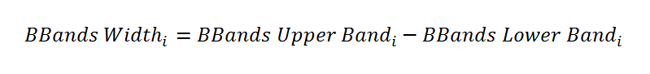
You can see how Bollinger Upper and Lower Bands are calculated in the BBands part of this article.
![]()
Commodity Channel Index (CCI)
Commodity Channel Index is calculated according to this formula:
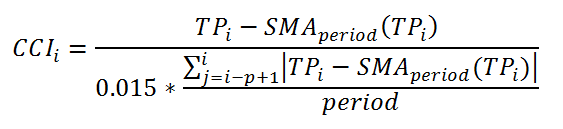
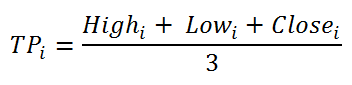
Where TP is a Typical Price calculated as:
And SMA is calculated as stated in SMA part of this article.
![]()
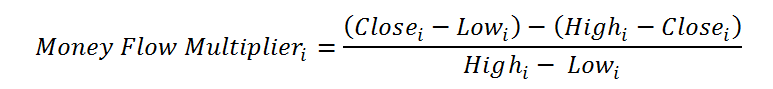
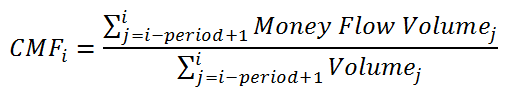
Chaikin Money Flow (CMF)
Chaikin Money Flow is calculated in three steps:
- First a MFMi is calculated for all points according to this formula:
- Next an MFVi value is calculated for all points like this:

- And finally the CMFi value is calculated according to this formula:
![]()
Chaikin Oscillator (CHO)
Chaikin Oscillator is calculated according to this formula:

You can see how the ADL indicator is calculated in the ADL part of this article.
![]()
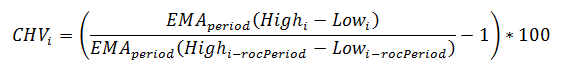
Chaikin Volatility (CHV)
Chaikin Volatility indicator in each point is calculated according to the following formula:
![]()
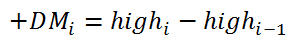
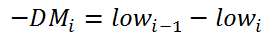
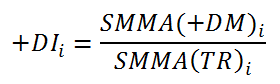
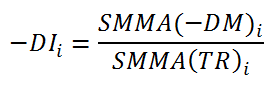
Directional Movement Indicator (DMI)
Directional Movement Indicator is calculated in three steps:
- First the True Range (TR), Plus Directional Movement (+DM) and Minus Directional Movement (-DM) are calculated for each period:

- Next they are smoothed using EMA or Wilder's method, calculated as:
- And finally the +DI and -DI values are calculated according to these formulas:
![]()
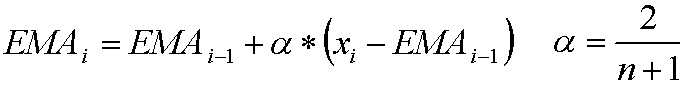
Exponential Moving Average (EMA)
Exponential Moving Average in each point is calculated according to the following formula:
![]()
Keltner Channels
Keltner Channels bands in each point are calculated according to the following formulas:
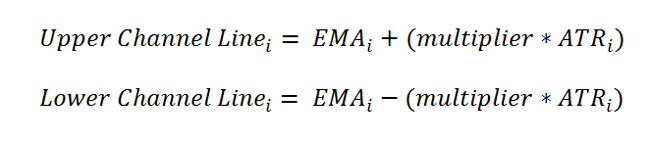
You can see how EMA (Exponential Moving Average) and ATR (Average True Range) indicators are calculated in corresponding sections of this article.
![]()
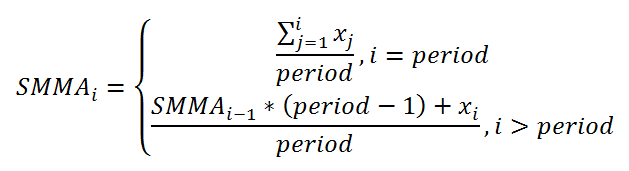
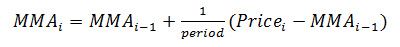
Modified (Smoothed) Moving Average (MMA)
Modified Moving Average indicator is quite similar to a Simple Moving Average and is calculated according to the following formula:
![]()
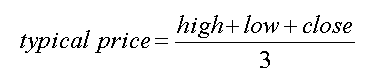
Money Flow Index (MFI)
Money Flow Index is calculated as follows:
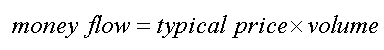
- The typical price for each day is the average of high, low and close:
- Money flow is the product of typical price and the volume on that day:
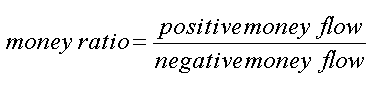
- Totals of the money flow amounts over the given N days are then formed. Positive money flow is the total for those days where the typical price is higher than the previous day's typical price, and negative money flow where below. If typical price is unchanged then that day is discarded.
- A money ratio is then formed:
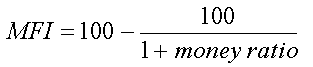
- From which a money flow index ranging from 0 to 100 is formed:
![]()
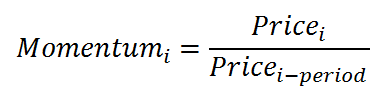
Momentum
Momentum indicator in each point is calculated in accordance to the folowing formula:
![]()
Moving Average Convergence/Divergence (MACD)
Moving Average Convergence/Divergence indicator is calculated as follows:
- EMA[slow period]i and EMA[fast period]i is calculated by EMA formula. Slow period and fast period are set by slow_period (default 26) and fast_period (default 12) attributes of <macd_indicator > node.
- MACD series value is calculated:

- EMA[signal period]i of MACD series values is calculated by EMA formula, where signal period is set by signal attribute of <macd_indicator > node.
- Signal series value is calculated:

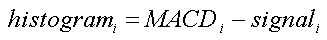
- Histogram series is calculated:
![]()
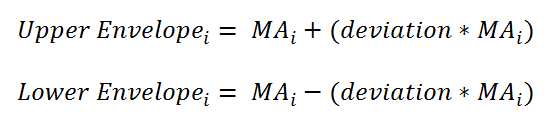
Moving Average Envelopes (MA Envelopes)
Moving Average Envelopes are calculated according to the following formulas:
![]()
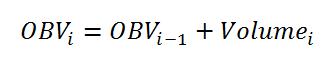
On Balance Volume (OBV)
On Balance Volume indicator is calculated according to the folowing rules:
- If the closing price is above the prior close price then:
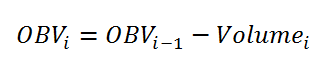
- If the closing price is below the prior close price then:
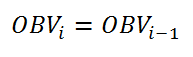
- If the closing prices equals yesterday's closing price then:
![]()
Parabolic SAR (PSAR)
Parabolic SAR is created according to the following algorithm.
At each step within a trend, the SAR is calculated ahead of time. That is, tomorrow's SAR value is built using data available today. The general formula used for this is:
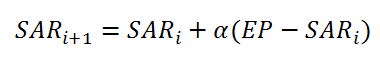
Where SARi and SARi - 1 represent today's and tomorrow's SAR values, respectively.
The extreme point, EP, is a record kept during each trend that represents the highest value reached by the price during the current up trend — or lowest value during a downtrend. On each period, if a new maximum (or minimum) is observed, the EP is updated with that value.
The α value represents the acceleration factor. Usually, this is set to a value of 0.02 initially. This factor is increased by 0.02 each time a new EP is recorded. Initial values is set using step_period attribute of <psar_indicator> node.
To keep it from getting too large, a maximum value for the acceleration factor is normally set at 0.20, so that it never goes beyond that. Maximum value for the acceleration factor is set using max_step_period attribute of <psar_indicator> node.
The SAR is recursively calculated in this manner for each new period. There are, however, two special cases that will modify the SAR value:
- If tomorrow's SAR value lies within (or beyond) today's or yesterday's price range, the SAR must be set to the closest price bound. For example, if in an up trend, the new SAR value is calculated and it results to be greater than today's or yesterday's lowest price, the SAR must be set equal to that lower boundary.
- If tomorrow's SAR value lies within (or beyond) tomorrow's price range, a new trend direction is then signaled, and the SAR must "switch sides." Upon a trend switch, several things happen. The first SAR value for this new trend is set to the last EP recorded on the previous trend. The EP is then reset accordingly to this period's maximum. The acceleration factor is reset to its initial value.
![]()
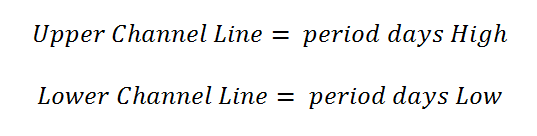
Price Channels
Price Channels bands are calculated according to the following formulas:
![]()
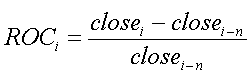
Rate of Change (ROC)
Rate of Change is calculated according to this formula:
![]()
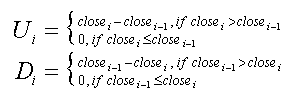
Relative Strength Index (RSI)
Relative Strength Index is calculated as follows:
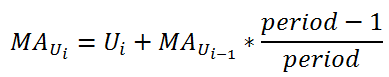
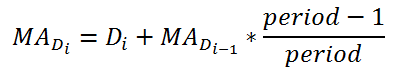
- Upward change (U) or downward change (D) sequences are calculated:
- Then two averages are calculated:
- And final RSI formula is :
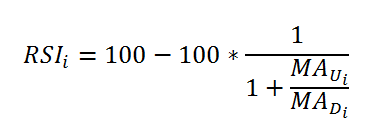
![]()
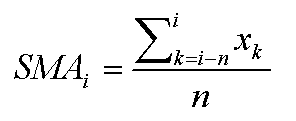
Simple Moving Average (SMA)
Simple Moving Average in each point is calculated according to the following formula:
![]()
Stochastic Oscillator (Full)
Stochastic Oscillator is calculated as follows:
- %K series is calculated according to this formula:
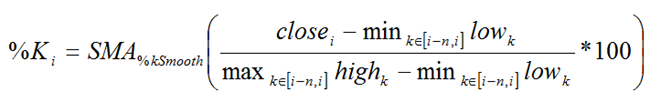
- %D series is calculated as the moving average of either SMA or EMA type calculated from %K series. The type is set using ma_type attribute of <stochastic_oscillator_indicator> node.
![]()
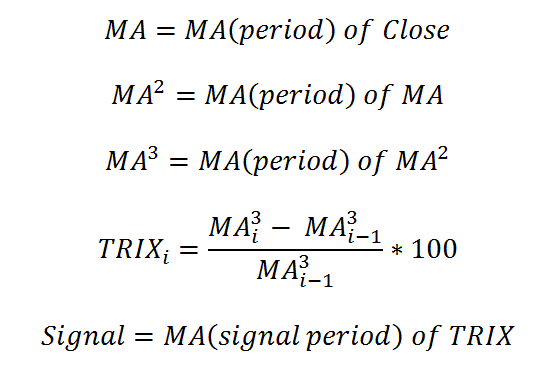
TRIX
TRIX indicator and its signal line are calculated in accordance to the folowing calculation flow:
![]()
Volume + MA
Volume + MA does no calculations with Volume and adds moving average of either SMA or EMA type calculated from Volume series. The type is set using ma_type attribute of <volume_ma_indicator> node.
![]()
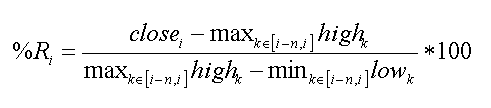
Williams %R
Williams %R is calculated according to this formula:
![]()