Money Flow Index (MFI)

Overview

Money flow index (MFI) is an oscillator calculated over an N-day period, ranging from 0 to 100, showing money flow on up days as a percentage of the total of up and down days.

AnyChart Stock allows you to add MFI with desired period to any of your charts.

Mathematical description of the indicator please see at: Mathematical Description of Technical Indicators

to top

Adding indicator

To add any indicator to the chart, you need to use Data Provider with the fields required by the indicator. When such Data Provider is ready - you can add indicator to the chart.

Preparing Data Provider

MFI indicator needs Data Provider with High, Low, Close and Volume fields.

Sample XML of Data Provider, which can be used to create MFI indicator:

XML Syntax:

XML/JSON Syntax
Plain code
01 <?xml version="1.0" encoding="UTF-8"?>
02 <stock xmlns="http://anychart.com/products/stock/schemas/1.9.0/schema.xsd">
03   <data>
04     <data_providers>
05       <general_data_providers>
06         <data_provider data_set="dataSet1" id="dp1">
07           <fields>
08             <field type="High" column="2" approximation_type="High" />
09             <field type="Low" column="3" approximation_type="Low" />
10             <field type="Close" column="4" approximation_type="Close" />
11             <field type="Volume" column="4" approximation_type="Sum" />
12           </fields>
13         </data_provider>
14       </general_data_providers>
15     </data_providers>
16   </data>
17 </stock>
01{
02  data: {
03    dataProviders: {
04      generalDataProviders: [
05        {
06          dataSet: "dataSet1",
07          id: "dp1",
08          fields: [
09            {
10              type: "High",
11              column: 2,
12              approximationType: "High"
13            },
14            {
15              type: "Low",
16              column: 3,
17              approximationType: "Low"
18            },
19            {
20              type: "Close",
21              column: 4,
22              approximationType: "Close"
23            },
24            {
25              type: "Volume",
26              column: 4,
27              approximationType: "Sum"
28            }
29          ]
30        }
31      ]
32    }
33  }
34}

to top

Indicator Declaration

As soon as Data Provider is ready you can add an indicator to a chart.

MFI indicator is usually shown on the chart above or below the chart with data (stock data). So we should declare it in another chart. Learn more about charts and layout in Chart Layout article.

XML for MFI declaration, note that there are two charts defined - one is used to show the stock data, and another one contains technical indicator:

XML/JSON Syntax
Plain code
01 <?xml version="1.0" encoding="UTF-8"?>
02 <stock xmlns="http://anychart.com/products/stock/schemas/1.9.0/schema.xsd">
03   <settings>
04     <charts>
05       <chart>
06         <series_list>
07           <series type="Line" data_provider="dpMsft" />
08         </series_list>
09       </chart>
10       <chart>
11         <technical_indicators>
12           <technical_indicator type="MFI" data_provider="dpMsft" />
13         </technical_indicators>
14       </chart>
15     </charts>
16   </settings>
17 </stock>
01{
02  settings: {
03    charts: [
04      {
05        seriesList: [
06          {
07            type: "Line",
08            dataProvider: "dpMsft"
09          }
10        ]
11      },
12      {
13        technicalIndicators: [
14          {
15            type: "MFI",
16            dataProvider: "dpMsft"
17          }
18        ]
19      }
20    ]
21  }
22}

Another important thing is the fact that MFI is measured on a 0 - 100 scale, so to show it properly we need to configure value axis scale in the chart with indicator, like that, for example:

XML/JSON Syntax
Plain code
01 <chart>
03     <technical_indicator type="MFI" data_provider="dpMsft" />
05   <value_axes>
06     <primary>
07       <scale minimum_mode="CustomValue" minimum="0" maximum_mode="CustomValue" maximum="100" interval_mode="CustomValue" interval="20" />
08     </primary>
09   </value_axes>
10 </chart>
01{
03    {
04      type: "MFI",
05      dataProvider: "dpMsft"
06    }
07  ],
08  valueAxes: {
09    primary: {
10      scale: {
11        minimumMode: "CustomValue",
12        minimum: 0,
13        maximumMode: "CustomValue",
14        maximum: 100,
15        intervalMode: "CustomValue",
16        interval: 20
17      }
18    }
19  }
20}

Of course you can use other steps or margins, if you'd like to, as described in Y-Axes Settings article.

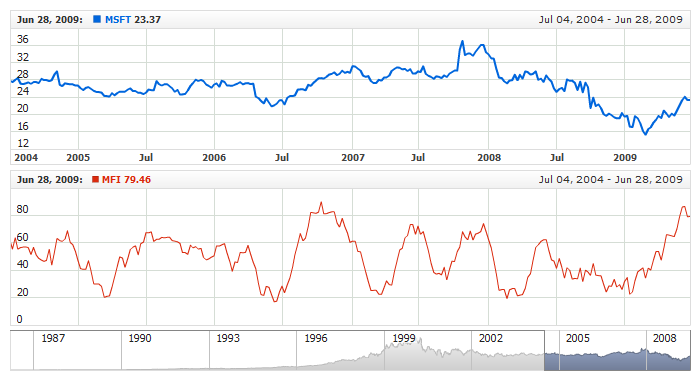
After all things mentioned above are done, you can create a chart with MFI indicator, see basic Live Sample with it below:

Live Sample:  Technical Indicators - Adding MFI Indicator

to top

Indicator parameters

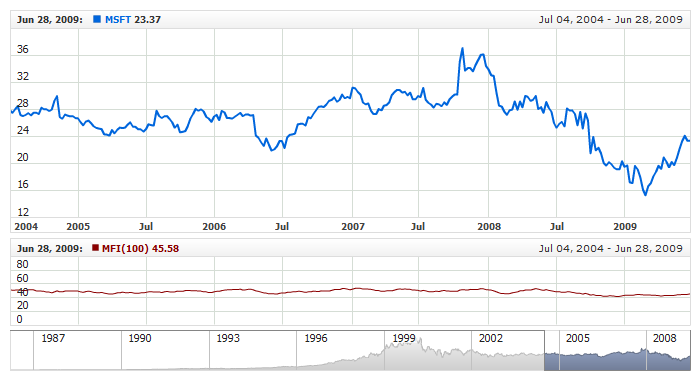
Money Flow Index has only one type specific parameter - period. Period is set in <mfi_indicator> node, where all settings for MFI indicator are set.

XML for setting MFI period:

XML/JSON Syntax
Plain code
01 <chart>
03     <technical_indicator type="MFI" data_provider="dpMsft">
04       <mfi_indicator period="100" />
05     </technical_indicator>
07 </chart>
01{
03    {
04      type: "MFI",
05      dataProvider: "dpMsft",
06      mfiIndicator: {
07        period: 100
08      }
09    }
10  ]
11}

As you can see you just need to set period attribute in <mfi_indicator> node, this attribute accepts any integer greater than 1.

Live sample below shows MFI(100):

Live Sample:  Technical Indicators - MFI Parameters

to top

Visualization

To visualize and tune visualization of technical indicators AnyChart Stock Component uses the same methods as for the data series.

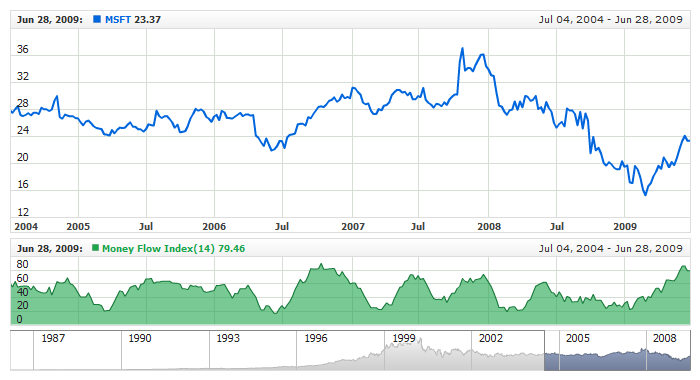
By default MFI is shown as series of Line type, but you can use almost any of available series types to show it on the chart - Spline, Area or Stick, for example.

MFI indicator settings are contained in <mfi_indicator> node, also in this node you can put <series> subnode - this node defines how exactly indicator is displayed on the chart. This node is identical to <series> node used to describe data series, so you can do with indicator anything you can do with series.

Sample XML for changing indicator visualization:

XML/JSON Syntax
Plain code
01 <chart>
03     <technical_indicator type="MFI" data_provider="dpMsft">
04       <mfi_indicator period="14">
05         <series type="Area" color="#1EA64E">
06           <name><![CDATA[Money Flow Index(14)]]></name>
07           <area_series>
08             <fill color="%Color" opacity="0.6" />
09             <line thickness="1" color="DarkColor(%Color)" opacity="1" />
10           </area_series>
11         </series>
12       </mfi_indicator>
13     </technical_indicator>
15 </chart>
01{
03    {
04      type: "MFI",
05      dataProvider: "dpMsft",
06      mfiIndicator: {
07        period: 14,
08        series: {
09          type: "Area",
10          color: "#1EA64E",
11          name: "Money Flow Index(14)",
12          areaSeries: {
13            fill: {
14              color: "%Color",
15              opacity: 0.6
16            },
17            line: {
18              thickness: 1,
19              color: "DarkColor(%Color)",
20              opacity: 1
21            }
22          }
23        }
24      }
25    }
26  ]
27}

Live sample below shows settings shown above:

Live Sample:  Technical Indicators - MFI Visualization Settings

to top

Overbought/Oversold Visualization

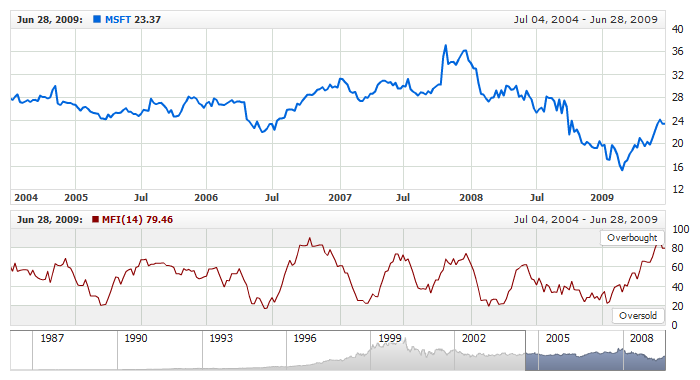
MFI can be used to determine if there is too much or too little volume associated with a security. A stock is considered "overbought" if the MFI indicator reaches 80 and above, and if MFI is 20 and below it is suggested that a stock is "oversold".

To chart Overbought and Oversold signals in AnyChart Stock you can use Line or Range axis markers with labels, which are described in

Live sample below shows MFI with labeled range axis markers used to highlight Overbought and Oversold signals:

Live Sample:  Technical Indicators - MFI with Overbought and Oversold Signals

to top