On Balance Volume (OBV)
Overview
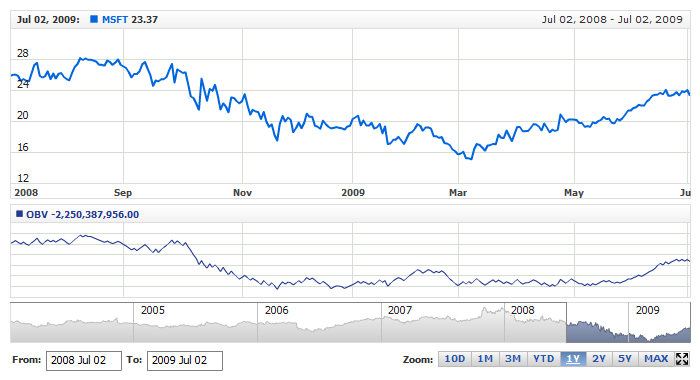
On Balance Volume (OBV) measures buying and selling pressure as a cumulative indicator that adds volume on up days and subtracts volume on down days. OBV was developed by Joe Granville and introduced in his 1963 book, Granville's New Key to Stock Market Profits. It was one of the first indicators to measure positive and negative volume flow. Chartists can look for divergences between OBV and price to predict price movements or use OBV to confirm price trends.
Mathematical description of the indicator please see at: Mathematical Description of Technical Indicators

Adding indicator
To add any indicator to the chart, you need to use Data Provider with the fields required by the indicator.
When such Data Provider is ready - you can add indicator to the chart.
Preparing Data Provider
OBV indicator needs Data Provider with Volume and Close or Value fields.
Sample XML of Data Provider, which can be used to create OBV indicator:
Indicator Declaration
As soon as Data Provider is ready you can add an indicator to a chart.
OBV indicator is usually
shown on the chart below the chart with data (stock data). So we should declare it in another chart. Learn more about charts and layout in Chart Layout article.
XML/JSON for OBV declaration, note that there are two charts defined - one is used to show the stock data, and another one contains technical
indicator:
01 |
<?xml version="1.0" encoding="UTF-8"?> |
02 |
<stock xmlns="http://anychart.com/products/stock/schemas/1.9.0/schema.xsd"> |
After all things mentioned above are done, you can create a chart with OBV indicator, see basic Live Sample with it below:
Live Sample: Technical Indicators - Adding OBV Indicator
Visualization
To visualize and tune visualization of technical indicators AnyChart Stock Component uses the same methods as for
the data series.
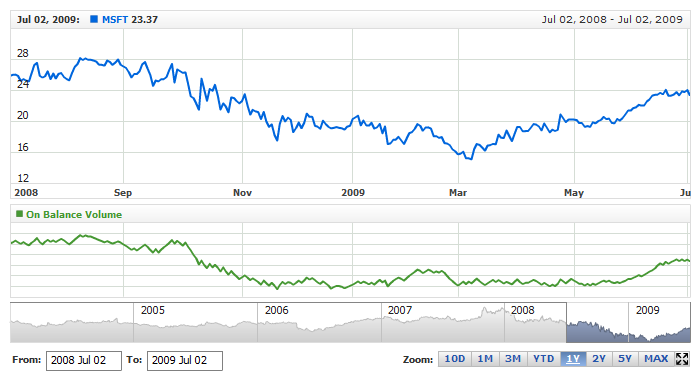
By default OBV is shown as series of Line type, but you can use almost any of available series types to show it on
the chart - Spline, Area or Stick, for example.
OBV indicator settings are contained in <obv_indicator> node, also in this node you can
put <series> subnode - this node defines how exactly indicator is displayed on the chart. This node is
identical to <series> node used to describe data series, so you can do with indicator anything you can do
with series.
Sample XML/JSON for changing indicator visualization:
06 |
<name><![CDATA[On Balance Volume]]></name> |
10 | name: "On Balance Volume", |
Live sample below shows settings shown above:
Live Sample: Technical Indicators - OBV Visualization Settings