Moving Average Convergence/Divergence (MACD)
Overview
MACD, which stands for Moving Average Convergence / Divergence, is a technical analysis indicator created by Gerald Appel in the 1960s. It shows the difference between a fast and slow exponential moving average (EMA) of closing prices.
AnyChart Stock allows you to add MFI with desired fast, slow and signal periods settings to any of your charts.
Mathematical description of the indicator please see at: Mathematical Description of Technical Indicators

Adding indicator
To add any indicator to the chart, you need to use Data Provider with the fields required by the indicator.
When such Data Provider is ready - you can add indicator to the chart.
Preparing Data Provider
MACD indicator needs Data Provider with Value or Close fields.
Sample XML of Data Provider, which can be used to create MACD indicator:
01 |
<?xml version="1.0" encoding="UTF-8"?> |
02 |
<stock xmlns="http://anychart.com/products/stock/schemas/1.9.0/schema.xsd"> |
Indicator Declaration
As soon as Data Provider is ready you can add an indicator to a chart.
MACD indicator is usually
shown on the chart above or below the chart with data (stock data). So we should declare it in another chart. Learn more about charts and layout in Chart Layout article.
XML for MACD declaration, note that there are two charts defined - one is used to show the stock data, and another one contains technical
indicator:
01 |
<?xml version="1.0" encoding="UTF-8"?> |
02 |
<stock xmlns="http://anychart.com/products/stock/schemas/1.9.0/schema.xsd"> |
Live Sample:
Live Sample: Technical Indicators - Adding MACD Indicator
Indicator parameters
MACD has three type specific parameters - fast, slow and signal period.
Periods are set in <macd_indicator> node, where all settings for MACD indicator are set.
XML for setting MACD periods:
As you can see you just need to set fast_period, slow_period
and signal_period attributes in <macd_indicator> node, these attributes
accept any integer greater than 1.
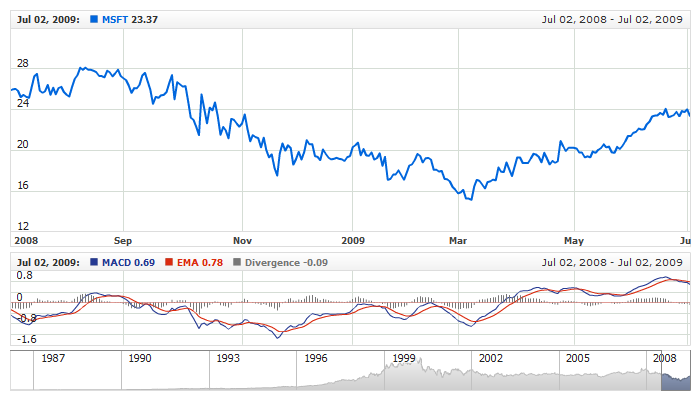
Live sample below shows classic MACD(26,12) with EMA(9) recommended back in the 1960s by Gerald Appel:
Live Sample: Technical Indicators - MACD Parameters
Visualization
To visualize and tune visualization of technical indicators AnyChart Stock Component uses the same methods as for the data series.
By default MACD is shown as series of Line type with divergence histogram shown as Stick, but you can use almost any of available series
types to show it on the chart.
MACD indicator settings are contained in <macd_indicator>node, also in this node
you can put <macd_series>, <signal_series>
and <histogram_series> subnodes - these nodes define how exactly indicator is displayed
on the chart. These nodes are identical to <series>node used to describe data series, so you
can do with indicator anything you can do with series.
Sample XML for changing indicator visualization:
29 | color: "DarkColor(%Color)", |
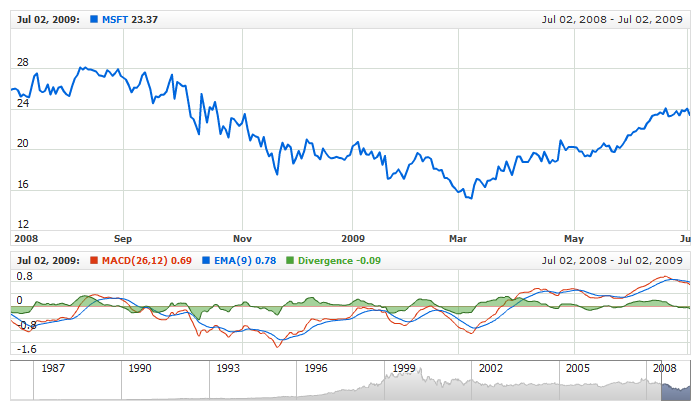
Live sample below shows settings shown above divergence histogram series is shown as Area:
Live Sample: Technical Indicators - MACD Visualization Settings