MA Envelopes

Overview

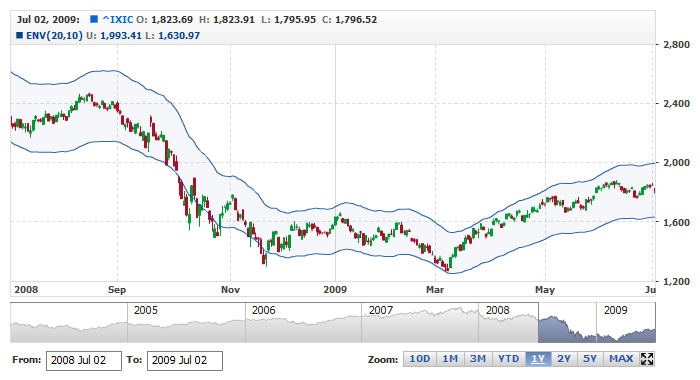
Moving Average Envelopes are percentage-based envelopes set above and below a moving average.

The moving average, which forms the base for this indicator, can be a simple or exponential moving average. Each envelope is then set the same percentage above or below the moving average. This creates parallel bands that follow price action. With a moving average as the base, Moving Average Envelopes can be used as a trend following indicator. However, this indicator is not limited to just trend following. The envelopes can also be used to identify overbought and oversold levels when the trend is relatively flat.

Mathematical description of the indicator please see at: Mathematical Description of Technical Indicators

to top

Adding indicator

To add any indicator to the chart, you need to use Data Provider with the fields required by the indicator. When such Data Provider is ready - you can add indicator to the chart.

Preparing Data Provider

MA Envelopes indicator needs Data Provider with Close or Value field.

Sample XML/JSON of Data Provider, which can be used to create MA Envelopes indicator:

XML/JSON Syntax
Plain code
03     <data_provider data_set="dataSet1" id="dpMsft">
04       <fields>
05         <field type="Close" column="4" approximation_type="Close" />
06       </fields>
07     </data_provider>
01{
03    {
04      dataSet: "dataSet1",
05      id: "dpMsft",
06      fields: [
07        {
08          type: "Close",
09          column: 4,
10          approximationType: "Close"
11        }
12      ]
13    }
14  ]
15}

In case if you use Data Provider for OHLC or Candlestick XML/JSON looks like that:

XML/JSON Syntax
Plain code
03     <data_provider data_set="dataSet1" id="dp1">
04       <fields>
05         <field type="Open" column="1" approximation_type="Open" />
06         <field type="High" column="2" approximation_type="High" />
07         <field type="Low" column="3" approximation_type="Low" />
08         <field type="Close" column="4" approximation_type="Close" />
09       </fields>
10     </data_provider>
01{
03    {
04      dataSet: "dataSet1",
05      id: "dp1",
06      fields: [
07        {
08          type: "Open",
09          column: 1,
10          approximationType: "Open"
11        },
12        {
13          type: "High",
14          column: 2,
15          approximationType: "High"
16        },
17        {
18          type: "Low",
19          column: 3,
20          approximationType: "Low"
21        },
22        {
23          type: "Close",
24          column: 4,
25          approximationType: "Close"
26        }
27      ]
28    }
29  ]
30}

to top

Indicator Declaration

As soon as Data Provider is ready you can add an indicator to a chart.

MA Envelopes indicator usually used as an Overlay indicator and displayed on the same chart with data series (stock data). So we should declare it in the chart where series is displayed.

XML/JSON for MA Envelopes declaration:

XML/JSON Syntax
Plain code
01 <chart>
02   <series_list>
03     <series type="Line" data_provider="dpMsft" color="#0066DD">
04       <line_series thickness="2" />
05       <name><![CDATA[MSFT]]></name>
06     </series>
07   </series_list>
09     <technical_indicator type="MAEnvelopes" data_provider="dpMsft" />
11 </chart>
01{
02  seriesList: [
03    {
04      type: "Line",
05      dataProvider: "dpMsft",
06      color: "#0066DD",
07      lineSeries: {
08        thickness: 2
09      },
10      name: "MSFT"
11    }
12  ],
14    {
15      type: "MAEnvelopes",
16      dataProvider: "dpMsft"
17    }
18  ]
19}

As you can see MAEnvelopes type is set to indicator using type attribute, and data_provider attribute specifies data provider with series and indicator data.

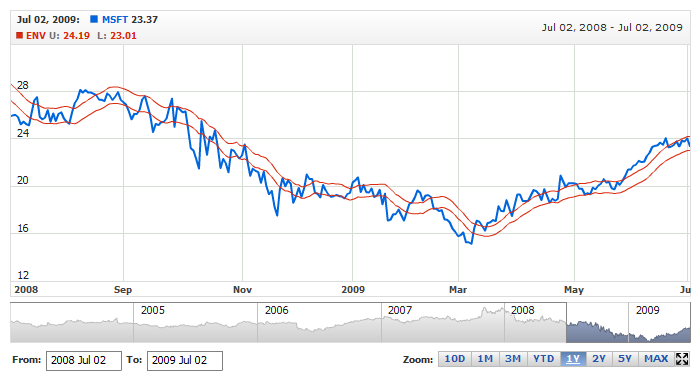
Live sample of the chart with MA Envelopes indicator:

Live Sample:  Technical Indicators - Adding MA Envelopes to a Chart

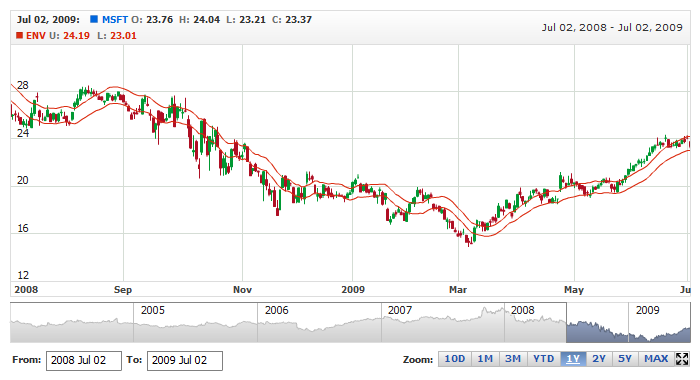
Another Sample shows MA Envelopes indicator with Candlestick series:

Live Sample:  Technical Indicators - Adding MA Envelopes to a Candlestick Chart

to top

Indicator parameters

MA Envelopes indicator has several specific parameters - period, deviation and ma_type. This parameter is set in <ma_envelopes_indicator> node, where all settings for MA Envelopes indicator are set.

XML/JSON for setting period parameter:

XML/JSON Syntax
Plain code
01 <?xml version="1.0" encoding="UTF-8"?>
02 <stock xmlns="http://anychart.com/products/stock/schemas/1.9.0/schema.xsd">
03   <settings>
04     <charts>
05       <chart>
06         <technical_indicators>
07           <technical_indicator type="MAEnvelopes" data_provider="dpMsft">
08             <ma_envelopes_indicator period="20" deviation="5" ma_type="SMA">
09               <upper_series>
10                 <name><![CDATA[ENV(20,2.5)]]></name>
11               </upper_series>
12             </ma_envelopes_indicator>
13           </technical_indicator>
14         </technical_indicators>
15       </chart>
16     </charts>
17   </settings>
18 </stock>
01{
02  settings: {
03    charts: [
04      {
05        technicalIndicators: [
06          {
07            type: "MAEnvelopes",
08            dataProvider: "dpMsft",
09            maEnvelopesIndicator: {
10              period: 20,
11              deviation: 5,
12              maType: "SMA",
13              upperSeries: {
14                name: "ENV(20,2.5)"
15              }
16            }
17          }
18        ]
19      }
20    ]
21  }
22}

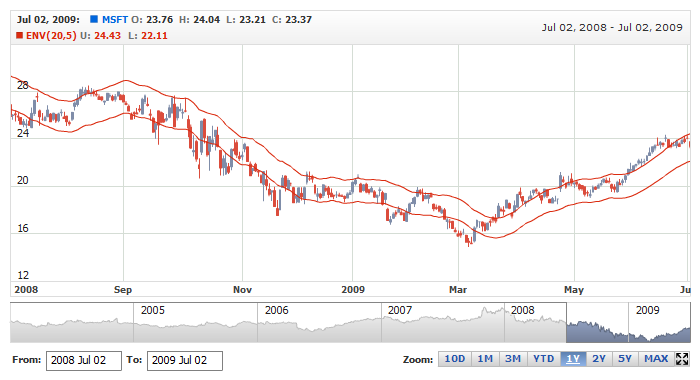
Live sample below shows MA Envelopes(20,5) based on SMA:

Live Sample:  Technical Indicators - MA Envelopes Parameters

to top

Visualization using lines

To visualize and tune visualization of technical indicators AnyChart Stock Component uses the same methods as for the data series.

By default upper envelope and lower envelope are shown as Lines, but you can use almost any of available series types to show it on the chart, for example, Spline or StepLine types.

MA Envelopes indicator settings are contained in <ma_envelopes_indicator> node, also in this node you can put <upper_series> and <lower_series> subnodes - these nodes define how exactly indicator is displayed on the chart. Nodes are identical to <series> node used to describe data series, so you can do with indicator anything you can do with series.

Sample XML/JSON for changing indicator visualization:

XML/JSON Syntax
Plain code
01 <?xml version="1.0" encoding="UTF-8"?>
02 <stock xmlns="http://anychart.com/products/stock/schemas/1.9.0/schema.xsd">
03   <settings>
04     <charts>
05       <chart>
06         <technical_indicators>
07           <technical_indicator type="MAEnvelopes" data_provider="dp1">
08             <ma_envelopes_indicator period="20" deviation="5" ma_type="SMA">
09               <upper_series color="#004492" type="Spline">
10                 <name><![CDATA[ENV(20,5)]]></name>
11               </upper_series>
12               <lower_series color="#004492" type="Spline" />
13             </ma_envelopes_indicator>
14           </technical_indicator>
15         </technical_indicators>
16       </chart>
17     </charts>
18   </settings>
19 </stock>
01{
02  settings: {
03    charts: [
04      {
05        technicalIndicators: [
06          {
07            type: "MAEnvelopes",
08            dataProvider: "dp1",
09            maEnvelopesIndicator: {
10              period: 20,
11              deviation: 5,
12              maType: "SMA",
13              upperSeries: {
14                color: "#004492",
15                type: "Spline",
16                name: "ENV(20,5)"
17              },
18              lowerSeries: {
19                color: "#004492",
20                type: "Spline"
21              }
22            }
23          }
24        ]
25      }
26    ]
27  }
28}

As you can see we changed visualization of upper and lower lines.

Live sample below shows settings described above:

Live Sample:  Technical Indicators - MA Envelopes Visualization Settings

to top

Visualization using RangeArea, RangeSplineArea or RangeBar

You can use RangeArea, RangeSplineArea or RangeBar area series to display MA Envelopes indicator's upper and lower envelopes.

To use these types of series, which need two values to be displayed, you have to enable special mode, as shown below:

XML/JSON Syntax
Plain code
01{
02  type: "MAEnvelopes",
03  dataProvider: "dpMsft",
05    useRangeBasedSeries: true
06  }
07}

As you can see use_range_based_series should be set to true to use this type of MA Envelopes visualization. When this flag is set to true you can use <range_based_series> node to set series type and configure it, along with legend, tooltip and so on. Sample series configuration (color, name, type) is shown below:

XML/JSON Syntax
Plain code
01 <?xml version="1.0" encoding="UTF-8"?>
02 <stock xmlns="http://anychart.com/products/stock/schemas/1.9.0/schema.xsd">
03   <settings>
04     <charts>
05       <chart>
06         <technical_indicators>
07           <technical_indicator type="MAEnvelopes" data_provider="dp1">
08             <ma_envelopes_indicator period="20" deviation="10" ma_type="EMA" use_range_based_series="true">
09               <range_based_series color="#004492" type="RangeArea">
10                 <range_area_series>
11                   <fill color="%Color" opacity="0.04" />
12                   <high>
13                     <line thickness="1" color="%Color" opacity="0.8" />
14                   </high>
15                   <low>
16                     <line thickness="1" color="%Color" opacity="0.8" />
17                   </low>
18                 </range_area_series>
19                 <name><![CDATA[ENV(20,10)]]></name>
20               </range_based_series>
21             </ma_envelopes_indicator>
22           </technical_indicator>
23         </technical_indicators>
24       </chart>
25     </charts>
26   </settings>
27 </stock>
01{
02  settings: {
03    charts: [
04      {
05        technicalIndicators: [
06          {
07            type: "MAEnvelopes",
08            dataProvider: "dp1",
09            maEnvelopesIndicator: {
10              period: 20,
11              deviation: 10,
12              maType: "EMA",
13              useRangeBasedSeries: true,
14              rangeBasedSeries: {
15                color: "#004492",
16                type: "RangeArea",
17                rangeAreaSeries: {
18                  fill: {
19                    color: "%Color",
20                    opacity: 0.04
21                  },
22                  high: {
23                    line: {
24                      thickness: 1,
25                      color: "%Color",
26                      opacity: 0.8
27                    }
28                  },
29                  low: {
30                    line: {
31                      thickness: 1,
32                      color: "%Color",
33                      opacity: 0.8
34                    }
35                  }
36                },
37                name: "ENV(20,10)"
38              }
39            }
40          }
41        ]
42      }
43    ]
44  }
45}

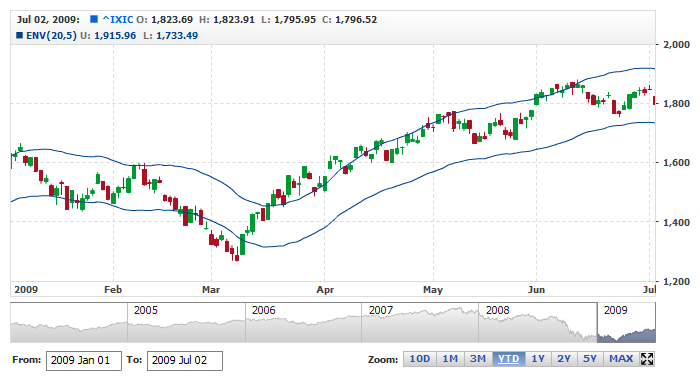
And here is a live sample with MA Envelopes drawn as RangeArea and legend configured accordingly:

Live Sample:  Technical Indicators - MA Envelopes Visualization using range based series types

to top