Bollinger Bands %B (BBands %B)
Overview
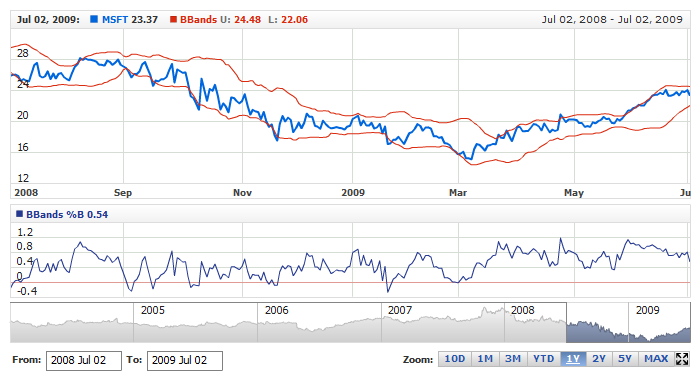
%B is an indicator derived from Bollinger Bands. In his book, Bollinger on Bollinger Bands, John Bollinger refers to %B as one of two indicators that can be derived from Bollinger Bands. The other indicator is Bollinger Band width.
%B quantifies a security's price relative to the upper and lower Bollinger Band. There are six basic relationship levels:
- %B equals 1 when price is at the upper band
- %B equals 0 when price is at the lower band
- %B is above 1 when price is above the upper band
- %B is below 0 when price is below the lower band
- %B is above .50 when price is above the middle band (SMA)
- %B is below .50 when price is below the middle band (SMA)
Mathematical description of the indicator please see at: Mathematical Description of Technical Indicators

Adding indicator
To add any indicator to the chart, you need to use Data Provider with the fields required by the indicator.
When such Data Provider is ready - you can add indicator to the chart.
Preparing Data Provider
BBands %B indicator needs Data Provider with Close or Value fields.
Sample XML of Data Provider, which can be used to create BBands %B indicator:
Indicator Declaration
As soon as Data Provider is ready you can add an indicator to a chart.
Unlike BBands themselves - BBands %B indicator is usually
shown on the chart below the chart with data (stock data). So we should declare it in another chart. Learn more about charts and layout in Chart Layout article.
XML for BBands %B declaration, note that there are two charts defined - one is used to show the stock data, and another one contains technical
indicator:
01 |
<?xml version="1.0" encoding="UTF-8"?> |
02 |
<stock xmlns="http://anychart.com/products/stock/schemas/1.9.0/schema.xsd"> |
After all things mentioned above are done, you can create a chart with BBands %B indicator, see basic Live Sample with it below:
Live Sample: Technical Indicators - Adding BBandsB Indicator
Indicator parameters
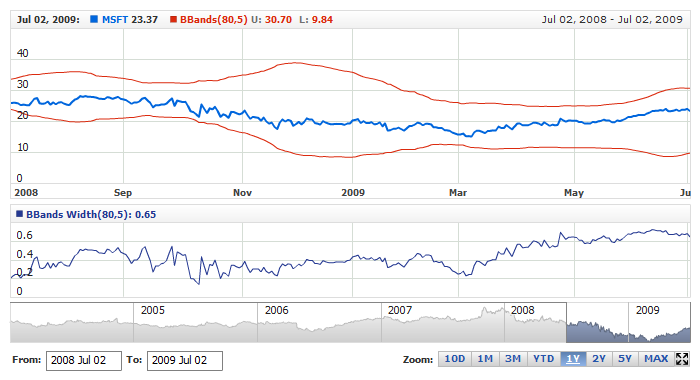
Bollinger Bands %B has specific parameters - period and deviation. They are set in <bbands_b_indicator> node, where all settings for BBands %B indicator are set.
XML for setting BBands %B parameters:
Live sample below shows BBandsB(80,5):
Live Sample: Technical Indicators - BBandsB Parameters
Visualization
To visualize and tune visualization of technical indicators AnyChart Stock Component uses the same methods as for
the data series.
By default BBands %B is shown as series of Line type, but you can use almost any of available series types to show it on
the chart - Spline, Area or Stick, for example.
BBands %B indicator settings are contained in <bbands_b_indicator> node, also in this node you can
put <series> subnode - this node defines how exactly indicator is displayed on the chart. This node is
identical to <series> node used to describe data series, so you can do with indicator anything you can do
with series.
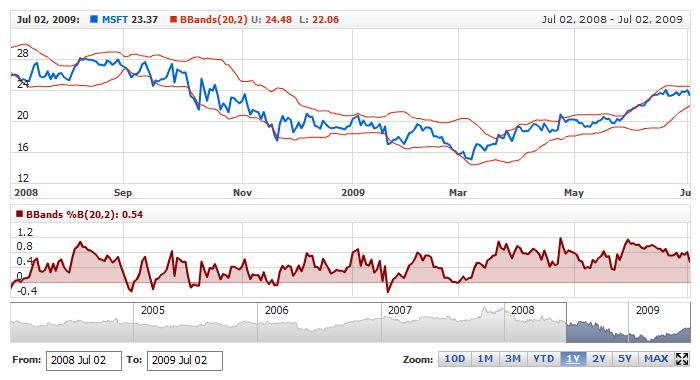
Sample XML for changing indicator visualization:
06 |
<name><![CDATA[BBands %B(20,2):]]></name> |
12 | name: "BBands %B(20,2):", |
Live sample below shows settings shown above:
Live Sample: Technical Indicators - BBandsB Visualization Settings