Rate of Change (ROC)
Overview
Rate of change (ROC) is a simple technical analysis indicator showing the difference between today's closing
price and the close N days ago.
AnyChart Stock allows you to add ROC with desired period to any of your charts.
Mathematical description of the indicator please see at: Mathematical Description of Technical Indicators

Adding indicator
To add any indicator to the chart, you need to use Data Provider with the fields required by the indicator.
When such Data Provider is ready - you can add indicator to the chart.
Preparing Data Provider
ROC indicator needs Data Provider with Close or Value fields.
Sample XML of Data Provider, which can be used to create ROC indicator:
01 |
<?xml version="1.0" encoding="UTF-8"?> |
02 |
<stock xmlns="http://anychart.com/products/stock/schemas/1.9.0/schema.xsd"> |
Indicator Declaration
As soon as Data Provider is ready you can add an indicator to a chart.
ROC indicator is usually
shown on the chart below the chart with data (stock data). So we should declare it in another chart. Learn more about charts and layout in Chart Layout article.
XML for ROC declaration, note that there are two charts defined - one is used to show the stock data, and another one contains technical
indicator:
01 |
<?xml version="1.0" encoding="UTF-8"?> |
02 |
<stock xmlns="http://anychart.com/products/stock/schemas/1.9.0/schema.xsd"> |
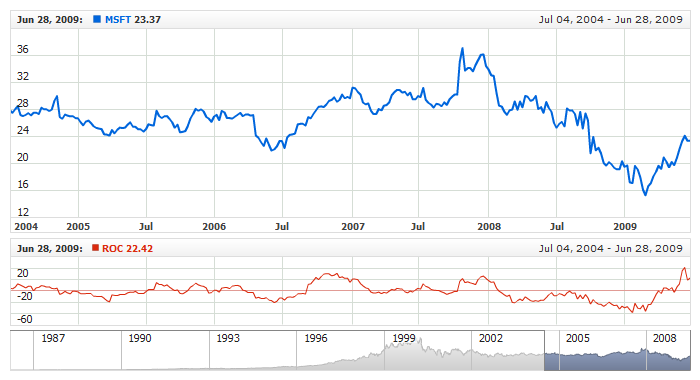
Live Sample:
Live Sample: Technical Indicators - Adding ROC Indicator
Indicator parameters
Rate of Change has only one type specific parameter - period. Period is set in <roc_indicator> node,
where all settings for ROC indicator are set.
XML for setting ROC period:
As you can see you just need to set period attribute in <roc_indicator> node,
this attribute accepts any integer greater than 1.
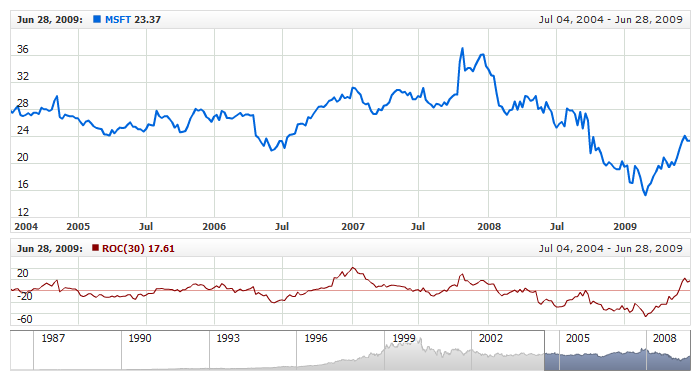
Live sample below shows ROC(30):
Live Sample: Technical Indicators - ROC Parameters
Visualization
To visualize and tune visualization of technical indicators AnyChart Stock Component uses the same methods as for
the data series.
By default ROC is shown as series of Line type, but you can use almost any of available series types to show it on
the chart - Spline, Area or Stick, for example.
ROC indicator settings are contained in <roc_indicator> node, also in this node you can
put <series> subnode - this node defines how exactly indicator is displayed on the chart. This node is
identical to <series> node used to describe data series, so you can do with indicator anything you can do
with series.
Sample XML for changing indicator visualization:
06 |
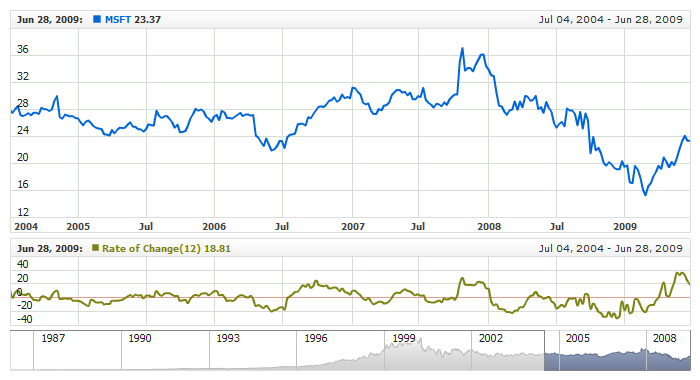
<name><![CDATA[Rate of Change(12)]]></name> |
11 | name: "Rate of Change(12)", |
Live sample below shows settings shown above:
Live Sample: Technical Indicators - ROC Visualization Settings