Price Channels Indicator
Overview
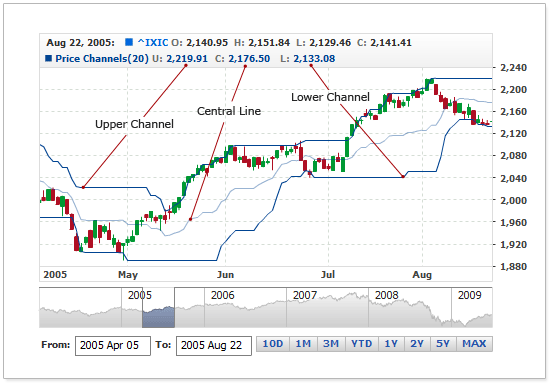
Price Channels are lines set above and below the price of a security. The upper channel is set at the x-period high and the lower channel is set at the x-period low. For a 20-day Price Channel, the upper channel would equal the 20-day high and the lower channel would equal the 20-day low. The dotted centerline is the midpoint between the two channel lines. Price Channels can be used to identify upward thrusts that signal the start of an uptrend or downward plunges that signal the start of a downtrend. Price Channels can also be used to identify overbought or oversold levels within a bigger downtrend or uptrend.
AnyChart Stock allows you to add Price Channels Indicator with desired period.
Mathematical description of the indicator please see at: Mathematical Description of Technical Indicators
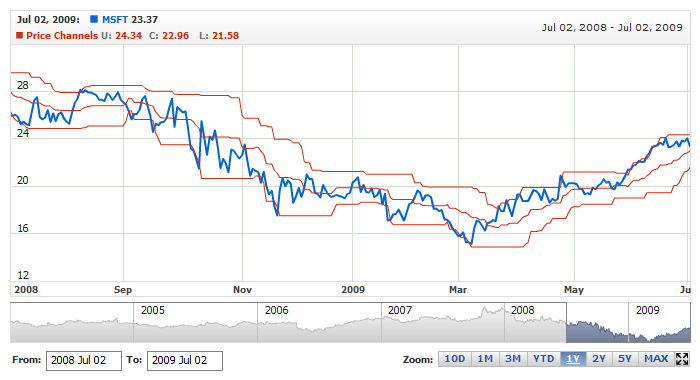
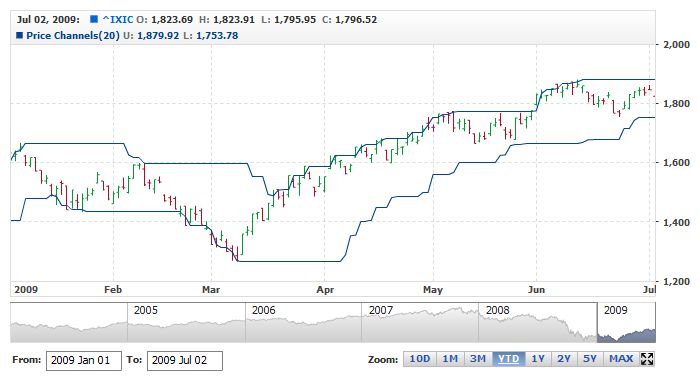
Illustration below shows how Price Channels indicator looks like in AnyStock:
As you can see, indicator consists of three series: Upper Channel, Lower Channel and Central Line, the latter is the difference between Upper Channel and Lower Channel. Below you will find all settings available for Price Channels.

Adding indicator
To add any indicator to the chart, you need to use Data Provider with the fields required by the indicator.
When such Data Provider is ready - you can add indicator to the chart.
Preparing Data Provider
Price Channels indicator needs Data Provider with High and Low fields.
Sample XML/JSON of Data Provider, which can be used to create Price Channels indicator:
In case if you use Data Provider for OHLC or Candlestick XML/JSON looks like that:
Indicator Declaration
As soon as Data Provider is ready you can add it to the chart.
Price Channels indicator usually used as an Overlay indicator and displayed on the same chart with data series (stock data). So we should declare it in the chart where series is displayed.
XML/JSON for Price Channels declaration:
15 | type: "PriceChannels", |
As you can see PriceChannels type is set to indicator using type attribute, and data_provider attribute specifies data provider with series and indicator data.
Live sample of the chart with Price Channels indicator:
Live Sample: Technical Indicators - Adding Price Channels to a Chart
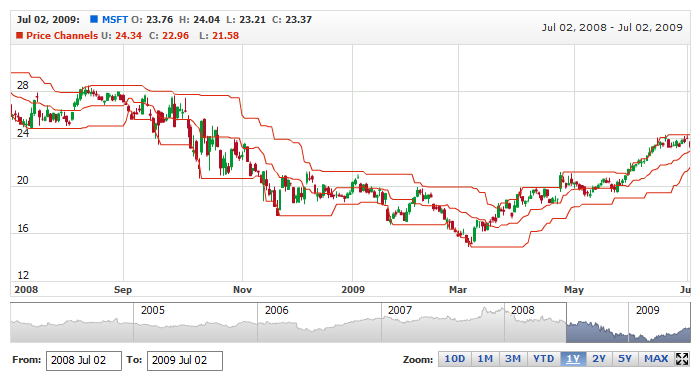
Another Sample shows Price Channels indicator with Candlestick series:
Live Sample: Technical Indicators - Adding Price Channels to a Candlestick Chart
Indicator parameters
Price Channels indicator has a specific parameter - period. This parameter is set in <price_channels_indicator> node, where all settings for Price Channels indicator are set.
XML/JSON for setting period parameter:
02 | type: "PriceChannels", |
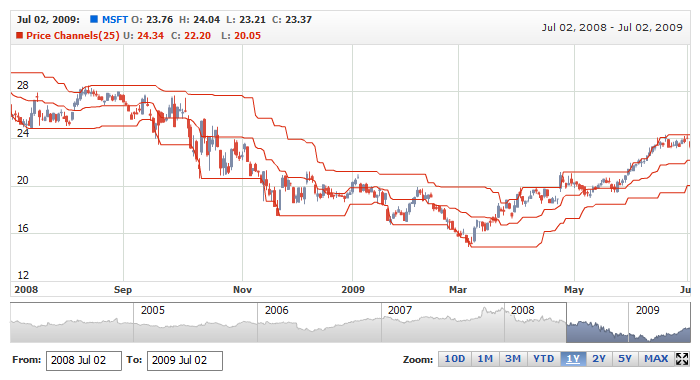
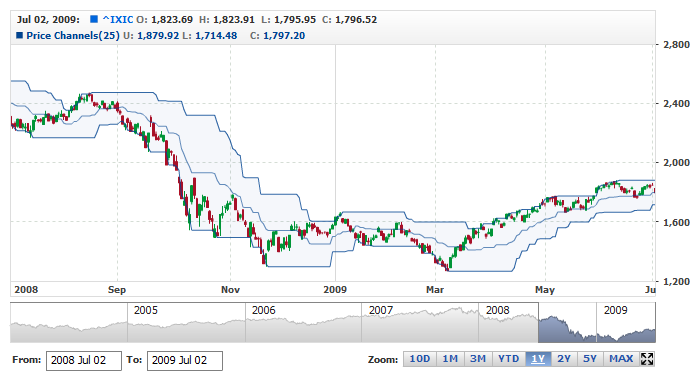
Live sample below shows Price Channels(25):
Live Sample: Technical Indicators - Price Channels Parameters
Visualization using lines
To visualize and tune visualization of technical indicators AnyChart Stock Component uses the same methods as for the data series.
By default upper channel and lower channel are shown as Lines, but you can use almost any of available series types to show it on the chart, for example, Spline or StepLine types.
Price Channels indicator settings are contained in <price_channels_indicator> node, also in this node you can put <upper_series> and <lower_series> subnodes - these nodes define how exactly indicator is displayed on the chart. Nodes are identical to <series> node used to describe data series, so you can do with indicator anything you can do with series.
Sample XML/JSON for changing indicator visualization:
02 | type: "PriceChannels", |
As you can see we changed visualization of upper and lower lines.
Live sample below shows settings described above:
Live Sample: Technical Indicators - Price Channels Visualization Settings
Visualization using RangeArea, RangeSplineArea or RangeBar
You can use RangeArea, RangeSplineArea or RangeBar area series to display Price Channel indicator's upper and lower channels.
To use these types of series, which need two values to be displayed, you have to enable special mode, as shown below:
02 | type: "PriceChannels", |
As you can see use_range_based_series should be set to true to use this type of Price Channels visualization. When this flag is set to true you can use <range_based_series> node to set series type and configure it, along with legend, tooltip and so on. Sample series configuration (color, name, type) is shown below:
04 |
<name><![CDATA[Price Channels(20)]]></name> |
02 | type: "PriceChannels", |
10 | name: "Price Channels(20)" |
And here is a live sample with Price Channels drawn as RangeArea and legend configured accordingly:
Live Sample: Technical Indicators - Price Channels Visualization using range based series types
Turning off Central Line
By default central line is displayed in Price Channels, if you don't want to show it you need to disable elements, that visualize it.
Sample XML/JSON snippet below shows how to do that:
02 | type: "PriceChannels", |
Live sample below shows Price Channels indicator without central line:
Live Sample: Technical Indicators - Price Channels turning off central line