Williams %R
Overview
Williams %R, or just %R, is a momentum indicator showing the current closing price in relation to the high and low of the past N days (for a given N). It was developed by trader and author Larry Williams and is used in the stock and commodities markets.
AnyChart Stock allows you to add Williams %R with desired period to any of your charts.
Mathematical description of the indicator please see at: Mathematical Description of Technical Indicators

Adding indicator
To add any indicator to the chart, you need to use Data Provider with the fields required by the indicator.
When such Data Provider is ready - you can add indicator to the chart.
Preparing Data Provider
Williams %R indicator needs Data Provider with High, Low and Close fields.
Sample XML of Data Provider, which can be used to create %R indicator:
Indicator Declaration
As soon as Data Provider is ready you can add an indicator to a chart.
Williams %R indicator is usually
shown on the chart below the chart with data (stock data). So we should declare it in another chart. Learn more about charts and layout in Chart Layout article.
XML for %R declaration:
Another important thing is the fact that Williams %R is measured on a -100 — 0 scale, so to show it properly we need to configure value axis scale in the chart with indicator, like that, for example:
Of course you can use other steps or margins, if you'd like to, as described in Y-Axes Settings article.
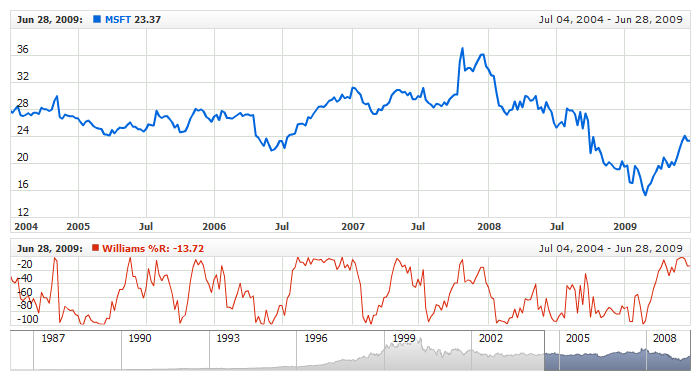
After all things mentioned above are done, you can create a chart with Williams %R indicator, see basic Live Sample with it below:
Live Sample: Technical Indicators - Adding WilliamsR Indicator
Indicator parameters
Williams %R has only one type specific parameter - period. Period is set in <williams_r_indicator> node,
where all settings for %R indicator are set.
XML for setting %R period:
As you can see you just need to set period attribute in <williams_r_indicator> node,
this attribute accepts any integer greater than 1.
Live sample:
Live Sample: Technical Indicators - WilliamsR Parameters
Visualization
To visualize and tune visualization of technical indicators AnyChart Stock Component uses the same methods as for
the data series.
By default Williams %R is shown as series of Line type, but you can use almost any of available series types to show it on
the chart - Spline, Area or Stick, for example.
Williams %R indicator settings are contained in <williams_r_indicator> node, also in this node you can
put <series> subnode - this node defines how exactly indicator is displayed on the chart. This node is
identical to <series> node used to describe data series, so you can do with indicator anything you can do
with series.
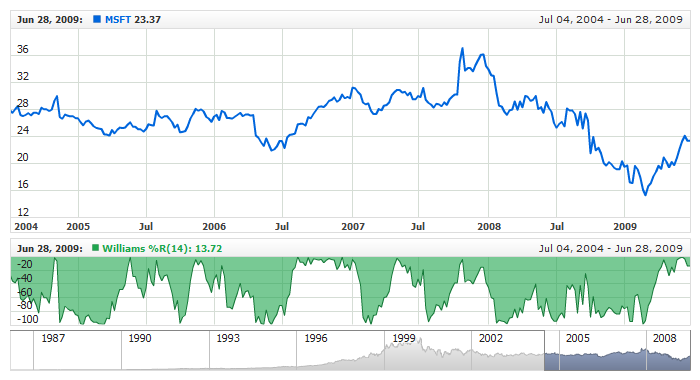
Sample XML for changing indicator visualization:
06 |
<name><![CDATA[Williams %R(14):]]></name> |
11 | name: "Williams %R(14):", |
19 | color: "DarkColor(%Color)", |
Also, in some cases you may want to omit minus sign in indicator legend, to do that you should modify legend item format
according to rules described in Number formatting article.
Formatting for legend in mouse over state looks like shown below, where negativeSignStyle:None makes negative values appear without minus sign:
01 |
<format><![CDATA[{%SeriesIcon} <b><font color="%Color">{%SeriesName} {%Value.Current}{numDecimals:2,negativeSignStyle:None}</font></b> ]]></format> |
02 | value: "{%SeriesIcon} <b><font color=\"%Color\">{%SeriesName} {%Value.Current}{numDecimals:2,negativeSignStyle:None}</font></b> " |
Live sample below shows all settings mentioned above:
Live Sample: Technical Indicators - WilliamsR Visualization Settings
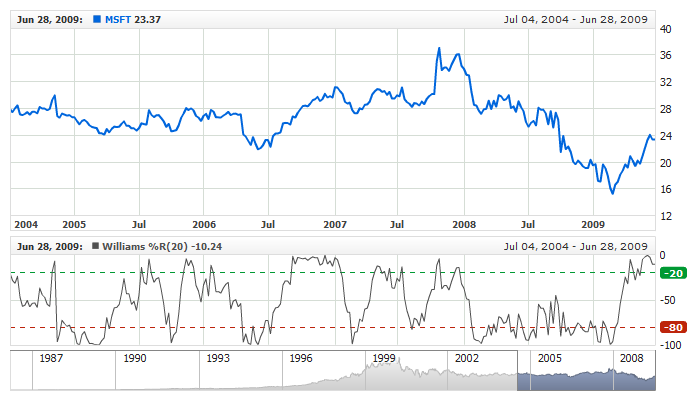
Overbought/Oversold Visualization
Williams %R is a momentum indicator that works much like the Stochastic Oscillator. It is especially popular for measuring
overbought and oversold levels. The scale ranges from 0 to -100 with readings from 0 to -20 considered overbought, and readings from -80 to -100
considered oversold.
To chart Overbought and Oversold signals in AnyChart Stock you can use Line or Range axis markers with labels, which are described in
Live sample below shows Williams %R with labeled line axis markers used to highlight Overbought and Oversold signals:
Live Sample: Technical Indicators - WilliamsR with Overbought and Oversold signals