Understanding Data Model
Overview
To start building charts with AnyChart Stock Component you have to understand its data model. It may look rather complex at the first sight, but actually it is very clean and simple and allows you to segregate data and visualization and provides a lot of options for data streaming and live update.
This article gives definitions to all building blocks of Data Model and link to the tutorials that describe all possible settings for each block.
We recommend you to read this article and then study Your first chart tutorial to see how this scheme works.
![]()
Data Model Scheme
The illustration below shows the Data Model of AnyChart Stock Component, the scheme can be described in words: each chart is based on one or several Data Sets, each data set gives data to one or several data providers, and data providers provide data to series, which are displayed on the chart. Please take a look at the scheme and continue reading the article, where we will give definitions and describe each part in details.
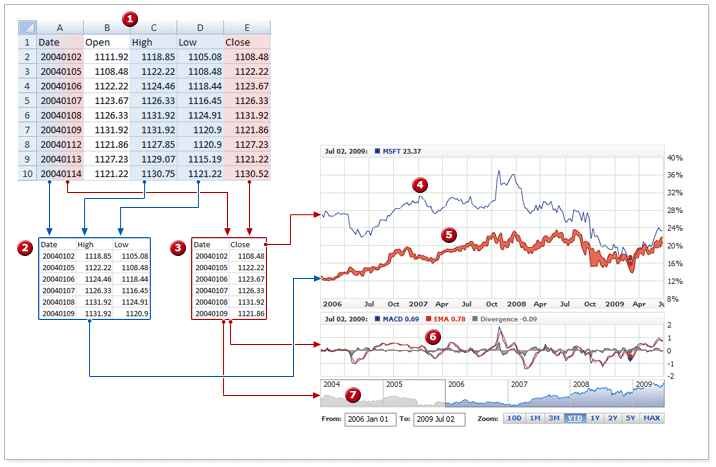
 Data set that holds five columns of the data.
 Data provider for Range Area Series with three fields.
 Data provider with two fields for MACD Technical Indicator and Scroller Thumbnail Series.
 Line Series displayed on the plot.
 Range Series displayed on the plot.
 MACD Technical Indicator displayed on the plot.
 Scroller thumbnails series displayed on the plot.
![]()
Data Sets
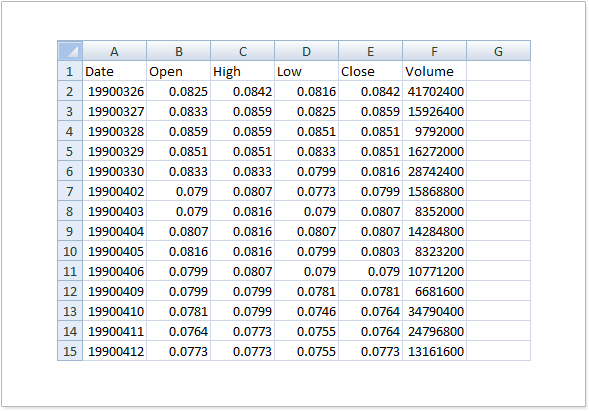
AnyChart Stock Component uses CSV formatted data as a data source. The source can be either an external CSV file, or part of configuration file. In settings you define what columns of CSV table are used and how they are used.
To show the most simple chart component needs CSV data table with at least two columns. One of these columns should contain Date Time values, because the component can use only Date Time values as the argument for the charts. Other column (or other columns) are used as values.
Below you can see a sample table, it is created and saved in CSV using some spreadsheet editor:
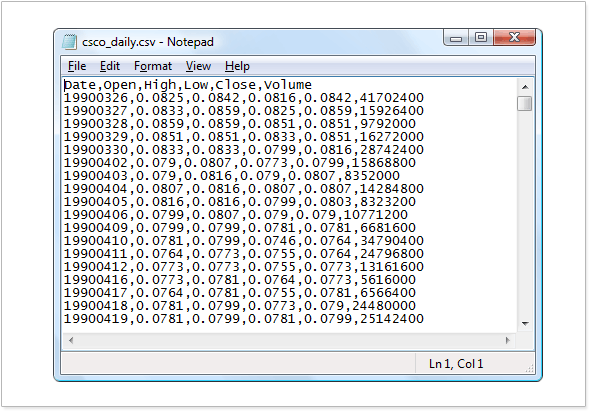
Or the same sample file, if it is viewed in a text editor:
Data Set represents single CSV table within AnyChart Stock data model.
Each data set has its own unique id, it either links to the external file or contains CSV table within, specifies what column in the table contains argument and tells the component how date time column is formatted.
You can have several data sets and show data from them in one or several chart panels.
Data Set only contains data and does nothing with them, data sets are used by Data Providers, which are described below.
To learn more what attributes are used to configure Date Sources please refer to:
![]()
Data Providers
The next building block of AnyChart Stock Data model is Data Provider.
Data Provider defines a subset of the CSV data table provided by some data set . Each data provider has the unique id and is bound to one data set. Data Provider selects several columns from the data set and defines their type. Certain series types require data providers with columns of the certain type.
To learn how Data Providers are configured please read:
![]()
Series
Probably the most important thing in data model is series:
Series is a visual representation of the data provider on the chart. Several series can show the same data provider in different way (for example as a Line and as an Area) and in different charts. There are several types of series and each of them has the list of required fields that should be declared in data provider.
To learn how Series are declared and configured please read:
![]()
Technical Indicators
A technical indicator is a type of analysis chart that indicates market direction. Indicators generally overlay on price chart data to indicate where the price is going, or whether the price is in an "overbought" condition or an "oversold" condition.
AnyChart Stock Chart Component supports automatic building of several types of technical indicators. Technical indicators are based on data from data providers and do not depend on series.
To learn what types of technical indicators are supported nand how to add them to the chart please see:
![]()
Scroller
Scroller is used to navigate through the chart and on most of the samples in documentation and in the gallery you can see a small chart that is drawn in the background of the scroller. This chart is intended to make navigation easier and needs some configuration. In short: you have to specify what data is used to draw this chart, which means - you have to specify data provider for it.
To learn how to do that please refer to this document:
![]()