Parabolic SAR (PSAR)
Overview
Parabolic SAR (SAR - stop and reverse) is a method devised by J. Welles Wilder, Jr, to find trends in market prices or securities. It may be used as a trailing stop loss based on prices tending to stay within a parabolic curve during a strong trend.
AnyChart Stock allows you to add PSAR indicator with desired step periods to any of your charts.
Mathematical description of the indicator please see at: Mathematical Description of Technical Indicators

Adding indicator
To add any indicator to the chart, you need to use Data Provider with the fields required by the indicator.
When such Data Provider is ready - you can add indicator to the chart.
Preparing Data Provider
PSAR indicator needs Data Provider with high and low fields.
Sample XML of Data Provider, which can be used to create PSAR indicator:
Indicator Declaration
As soon as Data Provider is ready you can add an indicator to a chart.
PSAR indicator is usually used as an Overlay indicator and displayed on the same chart with data series (stock data). So we should declare it in the chart where series is displayed.
XML for PSAR declaration:
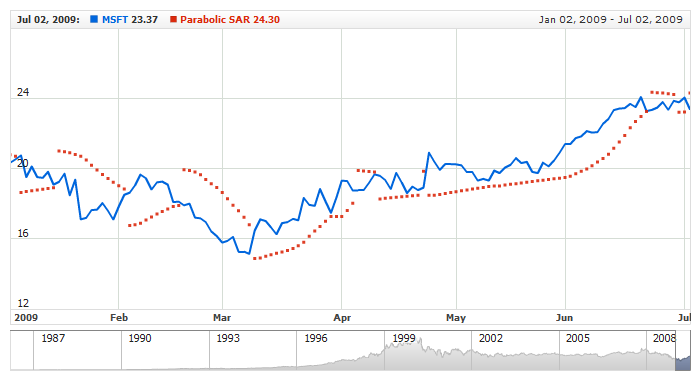
Live sample of the chart with PSAR indicator:
Live Sample: Technical Indicators - Adding PSAR Indicator
Indicator parameters
Parabolic SAR Indicator has two specific parameters. They are set in <psar_indicator> node,
where all settings for PSAR indicator are set.
XML for setting PSAR periods:
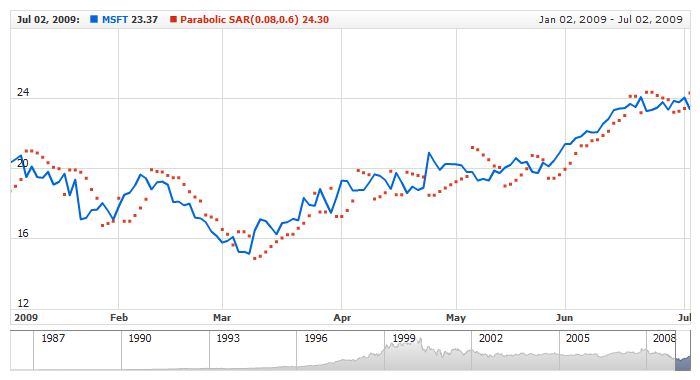
Live sample below shows Parabolic SAR(0.08,0.6):
Live Sample: Technical Indicators - PSAR Parameters
Visualization
To visualize and tune visualization of technical indicators AnyChart Stock Component uses the same methods as for the data series.
By default PSAR is shown as series of square markers, but you can use almost any of available series types to show it on the chart .
PSAR indicator settings are contained in <psar_indicator> node, also
in this node you can put <series> subnode - this node defines how exactly indicator is displayed
on the chart. This node is identical to <series> node used to describe data series, so you can
do with indicator anything you can do with series.
Sample XML for changing indicator visualization:
10 |
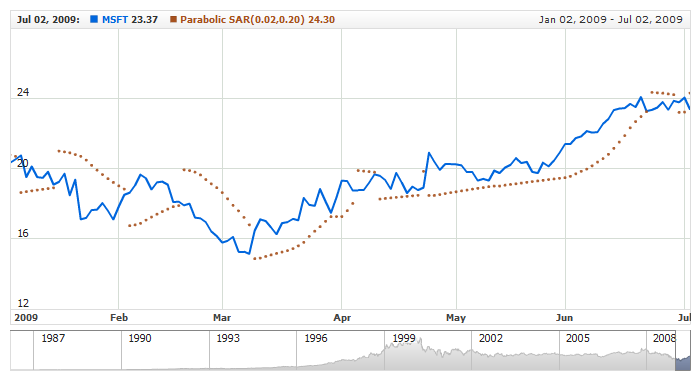
<name><![CDATA[Parabolic SAR(0.02,0.20)]]></name> |
21 | name: "Parabolic SAR(0.02,0.20)" |
As you can see we set periods and change marker type.
Live sample below shows settings described above:
Live Sample: Technical Indicators - PSAR Visualization Settings