Chaikin Volatility
Overview
Chaikin's volatility indicator calculates the spread between the maximum and minimum prices. It judges the value of volatility basing on the amplitude between the maximum and the minimum. Unlike Average True Range, Chaikin's indicator doesn't take gaps into account.
According to Chaikin's interpretation, a growth of volume indicator in a relatively short space of time means that the prices approach their minimum (like when the securities are sold in panic), while a decrease of volatility in a longer period of time indicates that the prices are on the peak (for example, in the conditions of a mature bull market).
AnyChart Stock allows you to add Chaikin Volatility with desired period to any of your charts.
Mathematical description of the indicator please see at: Mathematical Description of Technical Indicators

Adding indicator
To add any indicator to the chart, you need to use Data Provider with the fields required by the indicator.
When such Data Provider is ready - you can add indicator to the chart.
Preparing Data Provider
Chaikin Volatility indicator needs Data Provider with High and Low fields.
Sample XML of Data Provider, which can be used to create Chaikin Volatility indicator:
XML Syntax:
01 |
<?xml version="1.0" encoding="UTF-8"?> |
02 |
<stock xmlns="http://anychart.com/products/stock/schemas/1.9.0/schema.xsd"> |
Indicator Declaration
As soon as Data Provider is ready you can add an indicator to a chart.
Chaikin Volatility indicator is usually
shown on the chart above or below the chart with data (stock data). So we should declare it in another chart. Learn more about charts and layout in Chart Layout article.
XML for Chaikin Volatility declaration, note that there are two charts defined - one is used to show the stock data, and another one contains technical
indicator:
01 |
<?xml version="1.0" encoding="UTF-8"?> |
02 |
<stock xmlns="http://anychart.com/products/stock/schemas/1.9.0/schema.xsd"> |
15 | type: "ChaikinVolatility", |
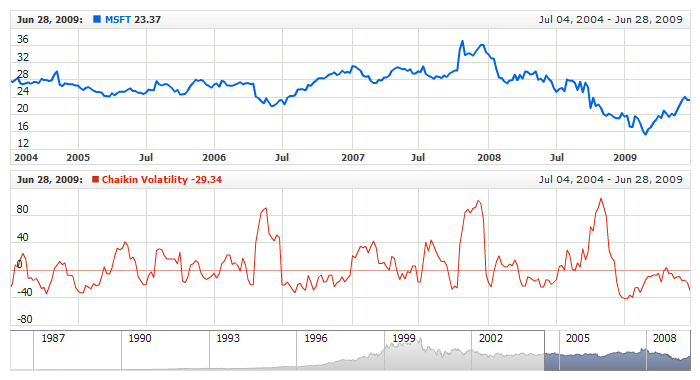
After all things mentioned above are done, you can create a chart with Chaikin Volatility indicator, see basic Live Sample with it below:
Live Sample: Technical Indicators - Adding Chaikin Volatility Indicator
Indicator parameters
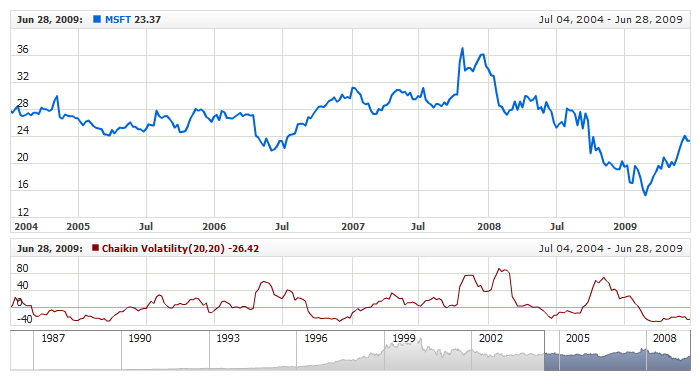
Chaikin Volatility has two type-specific parameters: period and Rate Of Change Period. They are set in <chaikin_volatility_indicator> node, where all settings for Chaikin Volatility indicator are set.
XML for setting Chaikin Volatility period:
04 | type: "ChaikinVolatility", |
As you can see you just need to set period and roc_period attributes in <chaikin_volatility_indicator> node, these attributes accept any integer greater than 1.
Live sample below shows Chaikin Volatility(20,20):
Live Sample: Technical Indicators - Chaikin Volatility Parameters
Visualization
To visualize and tune visualization of technical indicators AnyChart Stock Component uses the same methods as for the data series.
By default, Chaikin Volatility is shown as series of Line type, but you can use almost any of available series types to show it on the chart - Spline, Area or Stick, for example.
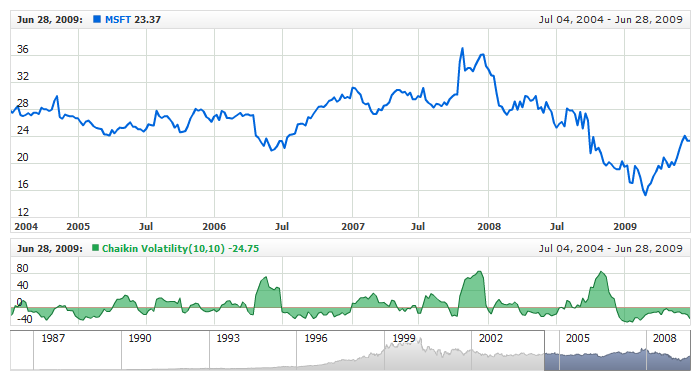
Chaikin Volatility indicator settings are contained in <chaikin_volatility_indicator> node, also in this node you can put <series> subnode - this node defines how exactly indicator is displayed on the chart. This node is identical to <series> node used to describe data series, so you can do with indicator anything you can do with series.
Sample XML for changing indicator visualization:
06 |
<name><![CDATA[Chaikin Volatility(10,10)]]></name> |
04 | type: "ChaikinVolatility", |
10 | name: "Chaikin Volatility(10,10)", |
18 | color: "DarkColor(%Color)", |
Live sample below shows settings shown above:
Live Sample: Technical Indicators - Chaikin Volatility Visualization Settings