Accumulation Distribution Line (ADL)
Overview
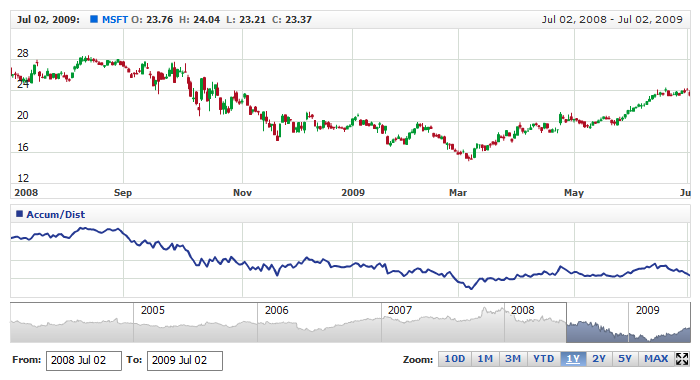
Developed by Marc Chaikin, the Accumulation Distribution Line is a volume-based indicator designed to measure the cumulative flow of money into and out of a security. Chaikin originally referred to the indicator as the Cumulative Money Flow Line. As with cumulative indicators, the Accumulation Distribution Line is a running total of each period's Money Flow Volume. First, a multiplier is calculated based on the relationship of the close to the high-low range. Second, the Money Flow Multiplier is multiplied by the period's volume to come up with a Money Flow Volume. A running total of the Money Flow Volume forms the Accumulation Distribution Line. Chartists can use this indicator to affirm a security's underlying trend or anticipate reversals when the indicator diverges from the security price.
Mathematical description of the indicator please see at: Mathematical Description of Technical Indicators

Adding indicator
To add any indicator to the chart, you need to use Data Provider with the fields required by the indicator.
When such Data Provider is ready - you can add indicator to the chart.
Preparing Data Provider
ADL indicator needs Data Provider with High, Low, Close and Volume fields.
Sample XML/JSON of Data Provider, which can be used to create ADL indicator:
Indicator Declaration
As soon as Data Provider is ready you can add an indicator to a chart.
ADL indicator is usually
shown on the chart below the chart with data (stock data). So we should declare it in another chart. Learn more about charts and layout in Chart Layout article.
XML/JSON for ADL declaration, note that there are two charts defined - one is used to show the stock data, and another one contains technical
indicator:
01 |
<?xml version="1.0" encoding="UTF-8"?> |
02 |
<stock xmlns="http://anychart.com/products/stock/schemas/1.9.0/schema.xsd"> |
After all things mentioned above are done, you can create a chart with ADL indicator, see basic Live Sample with it below:
Live Sample: Technical Indicators - Adding ADL Indicator
Visualization
To visualize and tune visualization of technical indicators AnyChart Stock Component uses the same methods as for
the data series.
By default ADL is shown as series of Line type, but you can use almost any of available series types to show it on
the chart - Spline, Area or Stick, for example.
ADL indicator settings are contained in <adl_indicator> node, also in this node you can
put <series> subnode - this node defines how exactly indicator is displayed on the chart. This node is
identical to <series> node used to describe data series, so you can do with indicator anything you can do
with series.
Sample XML for changing indicator visualization:
Live sample below shows settings shown above:
Live Sample: Technical Indicators - ADL Visualization Settings