DMI Indicator
Overview
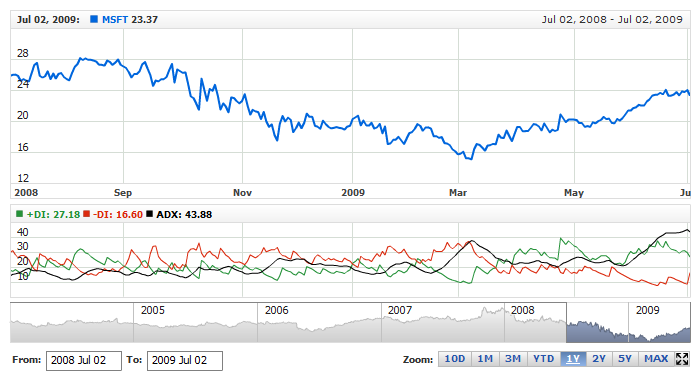
The concept of Directional Movement is based on the assumption that in an upward trend today’s highest price is higher than yesterday’s highest price, and in a downward trend today’s lowest price is lower than yesterday’s lowest price. If this is the case, it is a matter of the so-called Outside Days. The difference between today’s high and yesterday’s high corresponds to the Plus Directional Movement (+DI). The difference between today’s low and yesterday’s low is the Minus Directional Movement (-DI). These Outside Days consist of a +DI as well as an -DI. Modified moving average of the difference of +DI and -DI divided by the sum of +DI and -DI, multiplied by 100 is an ADX.
Days in which yesterday’s highest price or yesterday’s lowest price are not exceeded are described as Inside Days and contain a +DI and a -DI, or zero. Do not let the plus or minus sign designation mislead you. They only indicate upward or downward movement, not values. The directional movement value is always a positive number of absolute value, regardless of upward or downward movement. In the Directional Movement calculation, Inside Days are consequently not taken into account. It is possible for the directional movement to be zero. This occurs when the current trading range is inside the previous trading range, or when the trading ranges, current versus previous, are equal.
Mathematical description of the indicator please see at: Mathematical Description of Technical Indicators

Adding indicator
To add any indicator to the chart, you need to use Data Provider with the fields required by the indicator.
When such Data Provider is ready - you can add indicator to the chart.
Preparing Data Provider
DMI indicator needs data provider with High, Low and Close or Value fields.
Sample XML/JSON of Data Provider, which can be used to create DMI indicator:
01 |
<?xml version="1.0" encoding="UTF-8"?> |
02 |
<stock xmlns="http://anychart.com/products/stock/schemas/1.9.0/schema.xsd"> |
Indicator Declaration
As soon as Data Provider is ready you can add an indicator to a chart.
DMI indicator is usually
shown on the chart above or below the chart with data (stock data). So we should declare it in another chart. Learn more about charts and layout in Chart Layout article.
XML/JSON for DMI declaration, note that there are two charts defined - one is used to show the stock data, and another one contains technical
indicator:
01 |
<?xml version="1.0" encoding="UTF-8"?> |
02 |
<stock xmlns="http://anychart.com/products/stock/schemas/1.9.0/schema.xsd"> |
After all things mentioned above are done, you can create a chart with DMI indicator, see basic Live Sample with it below:
Live Sample: Technical Indicators - Adding DMI Indicator
Indicator parameters
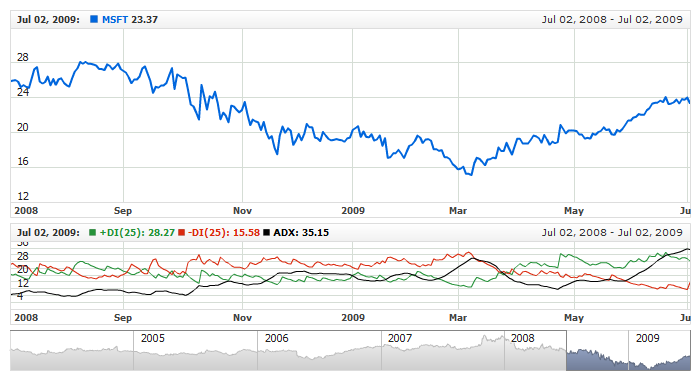
DMI indicator has three type specific parameters - DM period, DM smoothing type and ADX period. All three are set in <dmi_indicator> node, where all settings for DMI indicator are set.
XML/JSON for setting DMI parameters:
As you can see you just need to set period, adx_period and use_wilders_smoothing attributes in <dmi_indicator> node, period and adx_period attribute accept any integer greater than 1, and smoothing one accepts boolean values. Smoothing can be made by original Wilder's smoothing technic or as an exponential moving average.
Live sample below shows DMI(25) with Wilder smoothing:
Live Sample: Technical Indicators - DMI Parameters
Visualization
To visualize and tune visualization of technical indicators AnyChart Stock Component uses the same methods as for the data series.
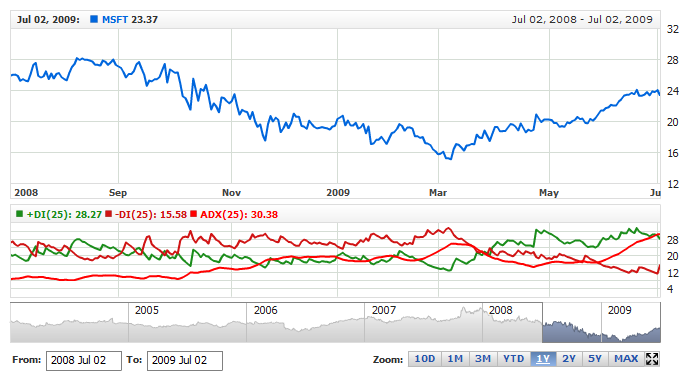
DMI indicator settings are contained in <dmi_indicator> node, also in this node you can put three subnodes: <pdi_series>, <ndi_series> and <adx_series> - these nodes define how exactly indicator is displayed on the chart. These nodes are identical to <series> node used to describe data series, so you can do with indicator anything you can do with series.
Note: By default ADX series is disabled in order to maintain backward compatibility, you need to enable it explicitly if you want to display it.
Sample XML/JSON for changing indicator visualization:
Live sample below shows settings shown above:
Live Sample: Technical Indicators - DMI Visualization Settings