TRIX

Overview

TRIX is a momentum oscillator that displays the percent rate of change of a triple exponentially smoothed moving average.

It was developed in the early 1980's by Jack Hutson, an editor for Technical Analysis of Stocks and Commodities magazine. With its triple smoothing, TRIX is designed to filter insignificant price movements. Chartists can use TRIX to generate signals similar to MACD. A signal line can be applied to look for signal line crossovers. A directional bias can be determined with the absolute level. Bullish and bearish divergences can be used to anticipate reversals.

to top

Adding indicator

To add any indicator to the chart, you need to use Data Provider with the fields required by the indicator. When such Data Provider is ready - you can add indicator to the chart.

Preparing Data Provider

TRIX indicator needs Data Provider with Close or Value field.

Sample XML/JSON of Data Provider, which can be used to create TRIX indicator:

XML Syntax:

XML/JSON Syntax
Plain code
01 <?xml version="1.0" encoding="UTF-8"?>
02 <stock xmlns="http://anychart.com/products/stock/schemas/1.9.0/schema.xsd">
03   <data>
04     <data_providers>
05       <general_data_providers>
06         <data_provider data_set="dataSet1" id="dp1">
07           <fields>
08             <field type="Close" column="4" approximation_type="Close" />
09           </fields>
10         </data_provider>
11       </general_data_providers>
12     </data_providers>
13   </data>
14 </stock>
01{
02  data: {
03    dataProviders: {
04      generalDataProviders: [
05        {
06          dataSet: "dataSet1",
07          id: "dp1",
08          fields: [
09            {
10              type: "Close",
11              column: 4,
12              approximationType: "Close"
13            }
14          ]
15        }
16      ]
17    }
18  }
19}

to top

Indicator Declaration

As soon as Data Provider is ready you can add an indicator to a chart.

TRIX indicator is usually shown on the chart above or below the chart with data (stock data). So we should declare it in another chart. Learn more about charts and layout in Chart Layout article.

XML/JSON for TRIX declaration, note that there are two charts defined - one is used to show the stock data, and another one contains technical indicator:

XML/JSON Syntax
Plain code
01 <?xml version="1.0" encoding="UTF-8"?>
02 <stock xmlns="http://anychart.com/products/stock/schemas/1.9.0/schema.xsd">
03   <settings>
04     <charts>
05       <chart>
06         <series_list>
07           <series type="Line" data_provider="dpMsft" />
08         </series_list>
09       </chart>
10       <chart>
11         <technical_indicators>
12           <technical_indicator type="TRIX" data_provider="dpMsft" />
13         </technical_indicators>
14       </chart>
15     </charts>
16   </settings>
17 </stock>
01{
02  settings: {
03    charts: [
04      {
05        seriesList: [
06          {
07            type: "Line",
08            dataProvider: "dpMsft"
09          }
10        ]
11      },
12      {
13        technicalIndicators: [
14          {
15            type: "TRIX",
16            dataProvider: "dpMsft"
17          }
18        ]
19      }
20    ]
21  }
22}

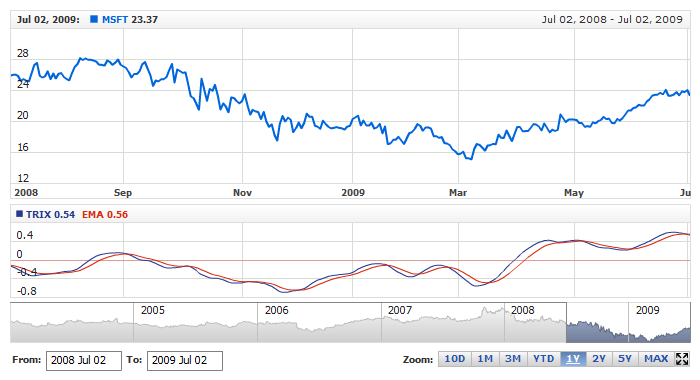
After all things mentioned above are done, you can create a chart with TRIX indicator, see basic Live Sample with it below:

Live Sample:  Technical Indicators - Adding TRIX Indicator

to top

Indicator parameters

TRIX has several type specific parameters - period, ma_type, signal_period and signal_ma_type. These attributes are set in <trix_indicator> node, where all settings for TRIX indicator are set.

Sample XML/JSON for setting TRIX periods and moving average types:

XML/JSON Syntax
Plain code
01 <chart>
03     <technical_indicator type="TRIX" data_provider="dpMsft">
04       <trix_indicator period="20" ma_type="EMA" signal_period="5" signal_ma_type="EMA" />
05     </technical_indicator>
07 </chart>
01{
03    {
04      type: "TRIX",
05      dataProvider: "dpMsft",
06      trixIndicator: {
07        period: 20,
08        maType: "EMA",
09        signalPeriod: 5,
10        signalMaType: "EMA"
11      }
12    }
13  ]
14}

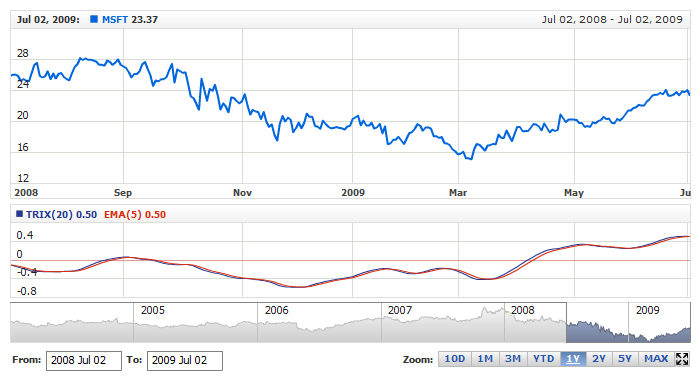
Live sample below shows TRIX(20) EMA(5):

Live Sample:  Technical Indicators - TRIX Parameters

to top

Visualization

To visualize and tune visualization of technical indicators AnyChart Stock Component uses the same methods as for the data series.

By default TRIX is shown as series of Line types, but you can use almost any of available series types to show it on the chart.

TRIX indicator settings are contained in <trix_indicator> node, also in this node you can put <series>, <signal_series> subnodes - these nodes define how exactly indicator is displayed on the chart. These nodes are identical to <series> node used to describe data series, so you can do with indicator anything you can do with series.

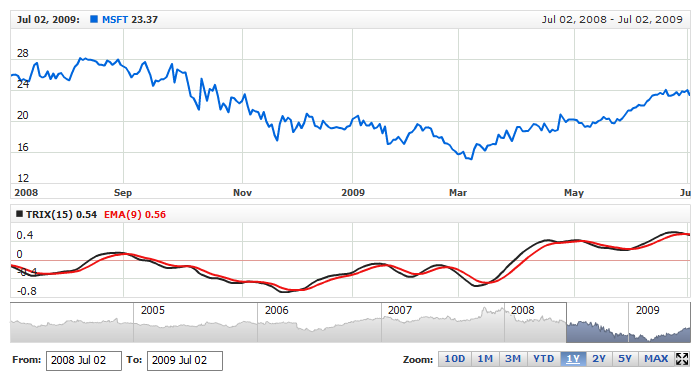
Sample XML/JSON for changing indicator visualization:

XML/JSON Syntax
Plain code
01 <chart>
03     <technical_indicator type="TRIX" data_provider="dpMsft">
04       <trix_indicator period="15" ma_type="EMA" signal_period="9" signal_ma_type="EMA">
05         <series type="Line" color="#222222">
06           <line_series thickness="2" />
07           <name><![CDATA[TRIX(15)]]></name>
08         </series>
09         <signal_series type="Line" color="#EE1313">
10           <line_series thickness="2" />
11           <name><![CDATA[EMA(9)]]></name>
12         </signal_series>
13       </trix_indicator>
14     </technical_indicator>
16 </chart>
01{
03    {
04      type: "TRIX",
05      dataProvider: "dpMsft",
06      trixIndicator: {
07        period: 15,
08        maType: "EMA",
09        signalPeriod: 9,
10        signalMaType: "EMA",
11        series: {
12          type: "Line",
13          color: "#222222",
14          lineSeries: {
15            thickness: 2
16          },
17          name: "TRIX(15)"
18        },
19        signalSeries: {
20          type: "Line",
21          color: "#EE1313",
22          lineSeries: {
23            thickness: 2
24          },
25          name: "EMA(9)"
26        }
27      }
28    }
29  ]
30}

Live sample below shows settings shown above:

Live Sample:  Technical Indicators - TRIX Indicator Visual Settings

to top