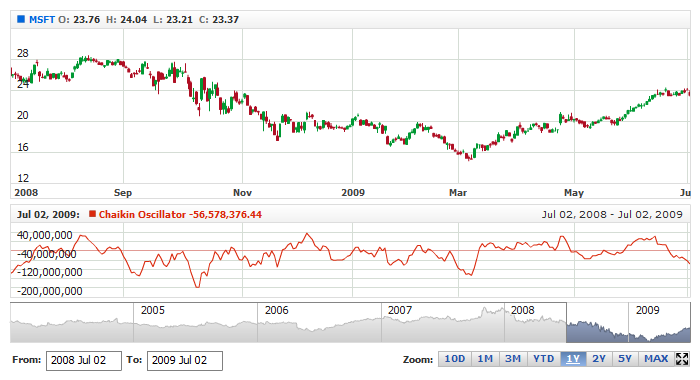
Chaikin Oscillator (CHO)
Overview
Developed by Marc Chaikin, the Chaikin Oscillator measures the momentum of the Accumulation Distribution Line using the MACD formula. This makes it an indicator of an indicator. The Chaikin Oscillator is the difference between the 3-day EMA of the Accumulation Distribution Line and the 10-day EMA of the Accumulation Distribution Line. Like other momentum indicators, this indicator is designed to anticipate directional changes in the Accumulation Distribution Line by measuring the momentum behind the movements. A momentum change is the first step to a trend change. Anticipating trend changes in the Accumulation Distribution Line can help chartists anticipate trend changes in the underlying security. The Chaikin Oscillator generates signals with crosses above/below the zero line or with bullish/bearish divergences.
Mathematical description of the indicator please see at: Mathematical Description of Technical Indicators

Adding indicator
To add any indicator to the chart, you need to use Data Provider with the fields required by the indicator.
When such Data Provider is ready - you can add indicator to the chart.
Preparing Data Provider
Chaikin Oscillator indicator needs Data Provider with High, Low, Close and Volume fields.
Sample XML/JSON of Data Provider, which can be used to create Chaikin Oscillator indicator:
Indicator Declaration
As soon as Data Provider is ready you can add an indicator to a chart.
Chaikin Oscillator indicator is usually
shown on the chart below the chart with data (stock data). So we should declare it in another chart. Learn more about charts and layout in Chart Layout article.
XML/JSON for Chaikin Oscillator declaration, note that there are two charts defined - one is used to show the stock data, and another one contains technical
indicator:
01 |
<?xml version="1.0" encoding="UTF-8"?> |
02 |
<stock xmlns="http://anychart.com/products/stock/schemas/1.9.0/schema.xsd"> |
15 | type: "ChaikinOscillator", |
After all things mentioned above are done, you can create a chart with Chaikin Oscillator indicator, see basic Live Sample with it below:
Live Sample: Technical Indicators - Adding Chaikin Oscillator Indicator
Indicator parameters
Chaikin Oscillator has three type-specific parameters - fast and slow periods and MA type.
These parameters are set in <chaikin_oscillator_indicator> node, where all settings for Chaikin Oscillator indicator are set.
XML for setting Chaikin Oscillator parameters:
02 | type: "ChaikinOscillator", |
As you can see you just need to set fast_period, slow_period
and ma_type attributes in <chaikin_oscillator_indicator> node, period attributes
accept any integer greater than 1 and the ma_type accepts "EMA" and "SMA" strings.
Live sample below shows smoothed CHO(20,6) with EMA:
Live Sample: Technical Indicators - Chaikin Oscillator Parameters
Visualization
To visualize and tune visualization of technical indicators AnyChart Stock Component uses the same methods as for
the data series.
By default Chaikin Oscillator is shown as series of Line type, but you can use almost any of available series types to show it on
the chart - Spline, Area or Stick, for example.
Chaikin Oscillator indicator settings are contained in <chaikin_oscillator_indicator> node, also in this node you can
put <series> subnode - this node defines how exactly indicator is displayed on the chart. This node is
identical to <series> node used to describe data series, so you can do with indicator anything you can do
with series.
Sample XML for changing indicator visualization:
04 | type: "ChaikinOscillator", |
Live sample below shows settings shown above:
Live Sample: Technical Indicators - Chaikin Oscillator Visualization Settings