Average True Range (ATR)
Overview
Developed by J. Welles Wilder, the Average True Range (ATR) is an indicator that measures volatility. As with most of his indicators, Wilder designed ATR with commodities and daily prices in mind. Commodities are frequently more volatile than stocks. They were are often subject to gaps and limit moves, which occur when a commodity opens up or down its maximum allowed move for the session. A volatility formula based only on the high-low range would fail to capture volatility from gap or limit moves. Wilder created Average True Range to capture this "missing" volatility. It is important to remember that ATR does not provide an indication of price direction, just volatility.
Mathematical description of the indicator please see at: Mathematical Description of Technical Indicators

Adding indicator
To add any indicator to the chart, you need to use Data Provider with the fields required by the indicator.
When such Data Provider is ready - you can add indicator to the chart.
Preparing Data Provider
ATR indicator needs Data Provider with High, Low and Close fields.
Sample XML/JSON of Data Provider, which can be used to create ATR indicator:
Indicator Declaration
As soon as Data Provider is ready you can add an indicator to a chart.
ATR indicator is usually
shown on the chart below the chart with data (stock data). So we should declare it in another chart. Learn more about charts and layout in Chart Layout article.
XML/JSON for ATR declaration, note that there are two charts defined - one is used to show the stock data, and another one contains technical
indicator:
01 |
<?xml version="1.0" encoding="UTF-8"?> |
02 |
<stock xmlns="http://anychart.com/products/stock/schemas/1.9.0/schema.xsd"> |
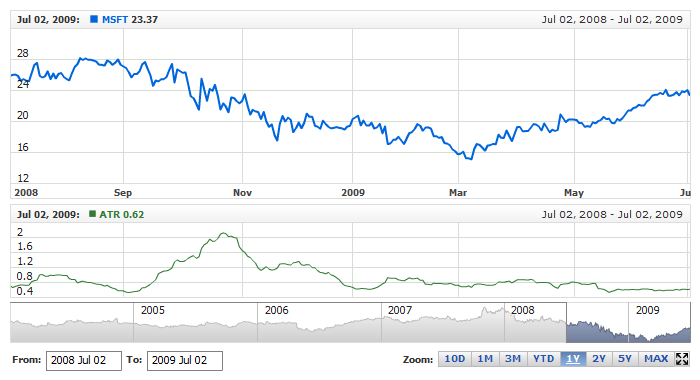
After all things mentioned above are done, you can create a chart with ATR indicator, see basic Live Sample with it below:
Live Sample: Technical Indicators - Adding ATR Indicator
Indicator parameters
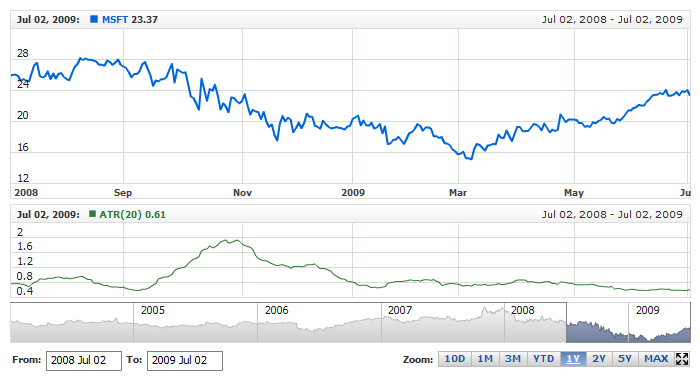
Average True Range indicator has only one type specific parameter - period. Period is set in <atr_indicator> node,
where all settings for ATR indicator are set.
XML/JSON for setting ATR period:
As you can see you just need to set period attribute in <atr_indicator> node,
this attribute accepts any integer greater than 1.
Live sample below shows ATR(20):
Live Sample: Technical Indicators - ATR Parameters
Visualization
To visualize and tune visualization of technical indicators AnyChart Stock Component uses the same methods as for
the data series.
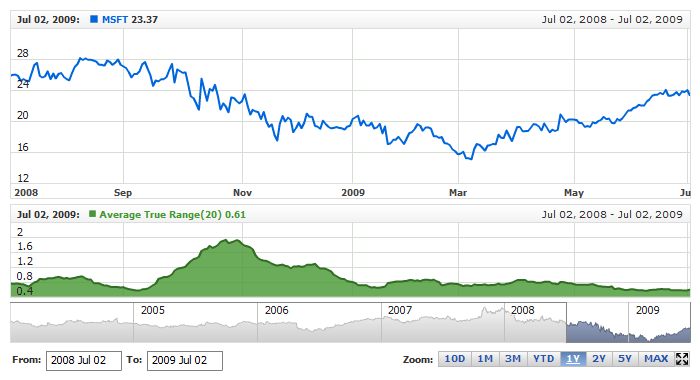
By default ATR is shown as series of Line type, but you can use almost any of available series types to show it on
the chart - Spline, Area or Stick, for example.
ATR indicator settings are contained in <atr_indicator> node, also in this node you can
put <series> subnode - this node defines how exactly indicator is displayed on the chart. This node is
identical to <series> node used to describe data series, so you can do with indicator anything you can do
with series.
Sample XML/JSON for changing indicator visualization:
06 |
<name><![CDATA[Average True Range(20)]]></name> |
11 | name: "Average True Range(20)" |
Live sample below shows settings shown above:
Live Sample: Technical Indicators - ATR Visualization Settings