Volume + MA
Overview
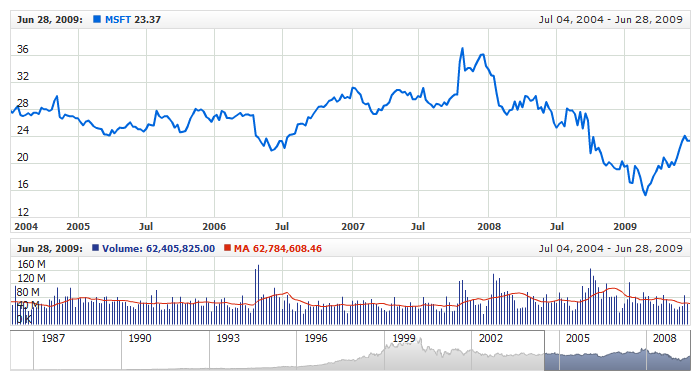
This is an indicator used in charts and technical analysis. It refers to the average volume of a security, commodity or index constructed in a period as short as a few minutes or as long as several years and showing trends for the latest interval.
AnyChart Stock allows you to add Volume MA with desired period and Moving Average type to any of your charts.
Mathematical description of the indicator please see at: Mathematical Description of Technical Indicators

Adding indicator
To add any indicator to the chart, you need to use Data Provider with the fields required by the indicator.
When such Data Provider is ready - you can add indicator to the chart.
Preparing Data Provider
Volume MA indicator needs Data Provider with Value or Close and Volume fields.
Sample XML of Data Provider, which can be used to create Volume MA indicator:
01 |
<?xml version="1.0" encoding="UTF-8"?> |
02 |
<stock xmlns="http://anychart.com/products/stock/schemas/1.9.0/schema.xsd"> |
In the above sample approximation type for Volume field is set to "Average", but for Volume+MA indicator you may find
useful to set it to "Sum", like that:
You can learn more about approximation types in Data Grouping and Values Approximation article.
Indicator Declaration
As soon as Data Provider is ready you can add an indicator to a chart.
Volume MA indicator is usually
shown on the chart below the chart with data (stock data). So we should declare it in another chart. Learn more about charts and layout in Chart Layout article.
XML for Volume MA declaration, note that there are two charts defined - one is used to show the stock data, and another one contains technical
indicator:
01 |
<?xml version="1.0" encoding="UTF-8"?> |
02 |
<stock xmlns="http://anychart.com/products/stock/schemas/1.9.0/schema.xsd"> |
Live Sample:
Live Sample: Technical Indicators - Adding VolumeMA Indicator
Indicator parameters
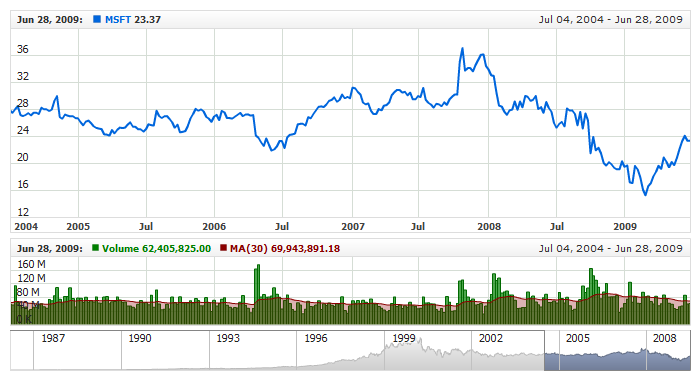
Volume MA has two type specific parameters - period and moving average type.
Both are set in <volume_ma_indicator> node,
where all settings for Volume MA indicator are set.
XML for setting Volume MA parameters:
As you can see you just need to set period attribute in <volume_ma_indicator> node,
this attribute accepts any integer greater than 1, and ma_type which can be either SMA or EMA.
Live sample below shows Volume MA with Simple Moving Average and period set to 50:
Live Sample: Technical Indicators - VolumeMA Parameters
Values Scaling
Due to the nature of Volume MA indicator it is supposed to show large values - millions and billions, but very long labels with big numbers are very hard to read and use that is why it may be useful to use values scaling in labels formatting, like we do in all samples in this article:
03 |
<format><![CDATA[{%Value}{scale:(1000)(1000)(1000)|( K)( M)( B),numDecimals:2,trailingZeros:false}]]></format> |
03 | format: "{%Value}{scale:(1000)(1000)(1000)|( K)( M)( B),numDecimals:2,trailingZeros:false}" |
This elegant representation of big numbers allows us to see axis labels and conform them with general look and feel of
compact charts. If you want to learn more about scaling and labels formatting, please see:
Visualization
To visualize and tune visualization of technical indicators AnyChart Stock Component uses the same methods as for
the data series.
By default Volume MA is shown as series of Stick and Line types, but you can use almost any of available series types to show it on
the chart - Spline, Area or Bar, for example.
Volume MA indicator settings are contained in <volume_ma_indicator> node, also in this node you can
put <volume_series> and <ma_series> subnodes - these nodes define how exactly
indicator is displayed on the chart. These nodes are
identical to <series> node used to describe data series, so you can do with indicator anything you can do
with series.
Sample XML for changing indicator visualization:
Live sample below shows settings shown above:
Live Sample: Technical Indicators - VolumeMA Visualization Settings