Adding Technical Indicators
Overview
A technical indicator is a type of analysis chart that indicates market direction. Indicators generally overlay on price chart data to indicate
where the price is going, or whether the price is in an "overbought" condition or an "oversold" condition.
AnyChart Stock Chart Component supports automatic building of several types of technical indicators.
Technical indicators are based on data from data providers and do not depend on series.

Adding Indicator
You can add technical indicator to the chart only when its Data Provider is ready,
and there is a Data Set, which contains data for Data Provider.
Here is a sample series definition XML:
Please note that this XML doesn't show data set and data provider definition.
01 |
<?xml version="1.0" encoding="UTF-8"?> |
02 |
<stock xmlns="http://anychart.com/products/stock/schemas/1.9.0/schema.xsd"> |
As you can see there is a <technical_indicators> node with <technical_indicator> in it.
Each indicator has the following common required attributes:
| Attribute |
Description |
| type |
Sets the type of technical indicator |
| data_provider |
Sets the Data Provider. |
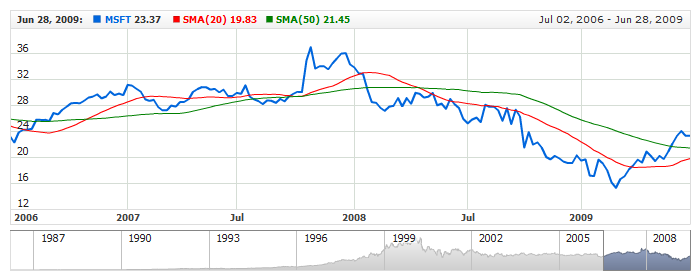
Indicator and Series on the Same Chart - SMA Sample
Take a look at the basic sample of the chart that contain two technical indicators: SMA(20) and SMA(50) that are displayed as the
lines on the same chart with price line series:
Live Sample: Adding Technical Indicators - SMA Basic
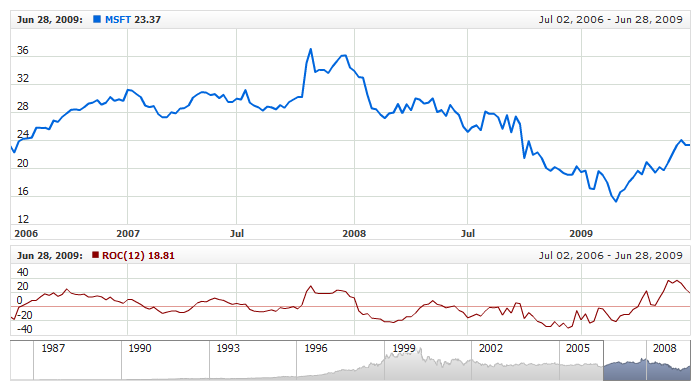
Indicator and Series on the different Charts - ROC Sample
Take a look at the basic sample of the chart that contains ROC(12) that is displayed as the
lines the synchronized chart below the main chart:
Live Sample: Adding Technical Indicators - ROC Basic
Further configuration of the way the indicator is displayed on the chart and settings of analysis related parameters
are done in a different way for each type of indicator. In the sample above that's the <sma_indicator> node with period attribute defined and <series> of Line type that describes how to color Simple Moving Average line on the chart. See more information about indicator types and their configuration below.
Indicator Types and Configuration
To see the list of supported indicator types and study how to configure appearance and parameters please see: