Volume
Overview
Volume is one of the basic indicators which shows just the trading volume.

Adding indicator
To add any indicator to the chart, you need to use Data Provider with the fields required by the indicator.
When such Data Provider is ready - you can add indicator to the chart.
Preparing Data Provider
Volume indicator needs Data Provider with Volume field.
Sample XML of Data Provider, which can be used to create Volume indicator:
01 |
<?xml version="1.0" encoding="UTF-8"?> |
02 |
<stock xmlns="http://anychart.com/products/stock/schemas/1.9.0/schema.xsd"> |
In the above sample approximation type for Volume field is set to "Average", but for Volume indicator you may find
useful to set it to "Sum", like that:
You can learn more about approximation types in Data Grouping and Values Approximation article.
Indicator Declaration
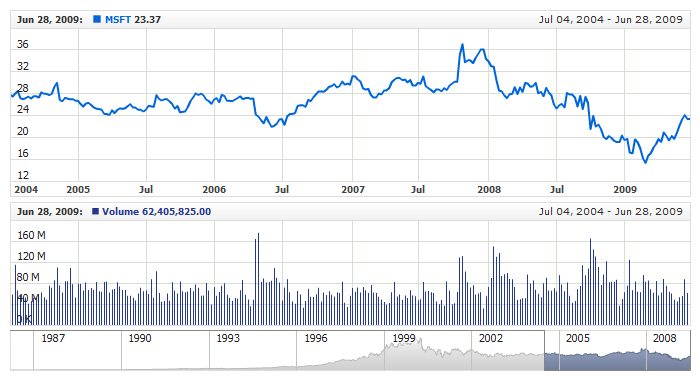
Volume in a separate chart
As soon as Data Provider is ready you can add an indicator to a chart.
Volume indicator is usually
shown on the chart below the chart with data (stock data). So we should declare it in another chart. Learn more about charts and layout in Chart Layout article.
XML for Volume declaration, note that there are two charts defined - one is used to show the stock data, and another one contains technical indicator:
01 |
<?xml version="1.0" encoding="UTF-8"?> |
02 |
<stock xmlns="http://anychart.com/products/stock/schemas/1.9.0/schema.xsd"> |
Live Sample:
Live Sample: Technical Indicators - Adding Volume Indicator - Separate Chart
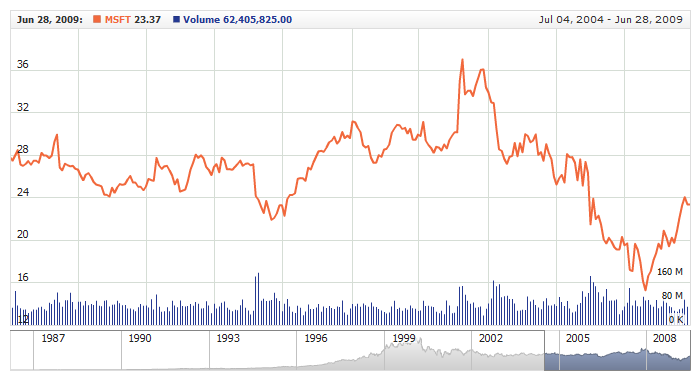
Volume in the same chart
Adding Volume indicator to the same chart is pretty much the same, but you need to, which is obvious, declare it in the same chart
and create an extra axis for it, because volume is measured in different units.
So, the declaration of Volume indicator in the same chart may look like that:
01 |
<?xml version="1.0" encoding="UTF-8"?> |
02 |
<stock xmlns="http://anychart.com/products/stock/schemas/1.9.0/schema.xsd"> |
16 |
<format><![CDATA[{%Value}{scale:(1000)(1000)(1000)|( K)( M)( B),numDecimals:2,trailingZeros:false}]]></format> |
25 | format: "{%Value}{scale:(1000)(1000)(1000)|( K)( M)( B),numDecimals:2,trailingZeros:false}" |
As you can see we have defined indicator and extra Y axis and we attached indicator to the axis using axis
attribute of <technical_indicator> node. As the result, we can create a chart like shown in a live sample below.
Note: scale_start_ratio and scale_end_ratio scale attributes are used in this sample
to make volume indicator occupy only 20% of the drawing area. Read more about these attributes at:
Y-Axes Settings: Limiting Scale Draw Region
Live Sample: Technical Indicators - Adding Volume Indicator - Same Chart
Values Scaling
Due to the nature of Volume indicator it is supposed to show large values - millions and billions, but very long labels with big numbers are very hard to read and use that is why it may be useful to use values scaling in labels formatting, like we do in all samples in this article:
03 |
<format><![CDATA[{%Value}{scale:(1000)(1000)(1000)|( K)( M)( B),numDecimals:2,trailingZeros:false}]]></format> |
03 | format: "{%Value}{scale:(1000)(1000)(1000)|( K)( M)( B),numDecimals:2,trailingZeros:false}" |
This elegant representation of big numbers allows us to see axis labels and conform them with general look and feel of
compact charts. If you want to learn more about scaling and labels formatting, please see:
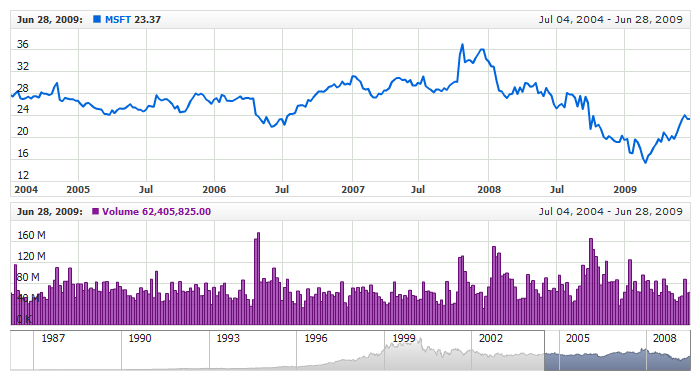
Visualization
To visualize and tune visualization of technical indicators AnyChart Stock Component uses the same methods as for
the data series.
By default Volume is shown as series of Stick type, but you can use almost any of available series types to show it on
the chart - Spline, Area or Bar, for example.
Volume indicator settings are contained in <volume_indicator> node, also in this node you can
put <series> subnode - this node defines how exactly indicator is displayed on the chart. This node is
identical to <series> node used to describe data series, so you can do with indicator anything you can do
with series.
Sample XML for changing indicator visualization:
Live sample below shows settings shown above:
Live Sample: Technical Indicators - Volume Visualization Settings