Keltner Channels Indicator

Overview

Keltner Channels are volatility-based envelopes set above and below an exponential moving average.

This indicator is similar to Bollinger Bands, which use the standard deviation to set the bands. Instead of using the standard deviation, Keltner Channels use the Average True Range (ATR) to set channel distance. The channels are typically set two Average True Range values above and below the 20-day EMA. The exponential moving average dictates direction and the Average True Range sets channel width. Keltner Channels are a trend following indicator used to identify reversals with channel breakouts and channel direction. Channels can also be used to identify overbought and oversold levels when the trend is flat.

Mathematical description of the indicator please see at: Mathematical Description of Technical Indicators

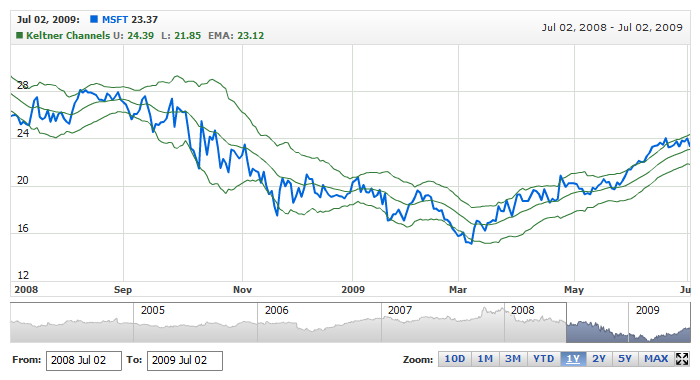
Illustration below shows how Keltner Channels indicator looks like in AnyStock:

AnyChart Stock Keltner Channels Indicator

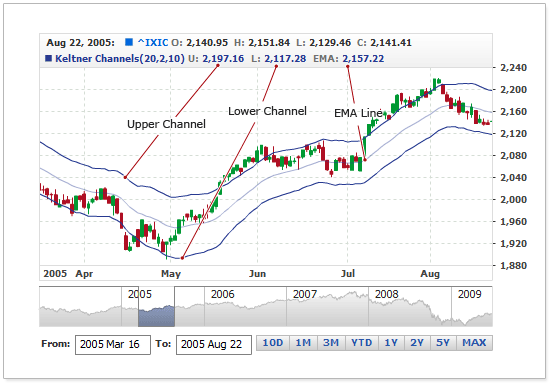
As you can see, indicator consists of three series: Upper Channel, Lower Channel and EMA Line. Below you will find all settings available for Keltner Channels.

to top

Adding indicator

To add any indicator to the chart, you need to use Data Provider with the fields required by the indicator. When such Data Provider is ready - you can add indicator to the chart.

Preparing Data Provider

Keltner Channels indicator needs Data Provider with High, Low and Close fields.

Sample XML/JSON of Data Provider, which can be used to create Keltner Channels indicator:

XML/JSON Syntax
Plain code
03     <data_provider data_set="dataSet1" id="dpMsft">
04       <fields>
05         <field type="High" column="2" approximation_type="High" />
06         <field type="Low" column="3" approximation_type="Low" />
07         <field type="Close" column="4" approximation_type="Close" />
08       </fields>
09     </data_provider>
01{
03    {
04      dataSet: "dataSet1",
05      id: "dpMsft",
06      fields: [
07        {
08          type: "High",
09          column: 2,
10          approximationType: "High"
11        },
12        {
13          type: "Low",
14          column: 3,
15          approximationType: "Low"
16        },
17        {
18          type: "Close",
19          column: 4,
20          approximationType: "Close"
21        }
22      ]
23    }
24  ]
25}

In case if you use Data Provider for OHLC or Candlestick XML/JSON looks like that:

XML/JSON Syntax
Plain code
03     <data_provider data_set="dataSet1" id="dp1">
04       <fields>
05         <field type="Open" column="1" approximation_type="Open" />
06         <field type="High" column="2" approximation_type="High" />
07         <field type="Low" column="3" approximation_type="Low" />
08         <field type="Close" column="4" approximation_type="Close" />
09       </fields>
10     </data_provider>
01{
03    {
04      dataSet: "dataSet1",
05      id: "dp1",
06      fields: [
07        {
08          type: "Open",
09          column: 1,
10          approximationType: "Open"
11        },
12        {
13          type: "High",
14          column: 2,
15          approximationType: "High"
16        },
17        {
18          type: "Low",
19          column: 3,
20          approximationType: "Low"
21        },
22        {
23          type: "Close",
24          column: 4,
25          approximationType: "Close"
26        }
27      ]
28    }
29  ]
30}

to top

Indicator Declaration

As soon as Data Provider is ready you can add an indicator to a chart.

Keltner Channels indicator usually used as an overlay indicator and displayed on the same chart with data series (stock data). So we should declare it in the chart where series is displayed.

XML/JSON for Keltner Channels declaration:

XML/JSON Syntax
Plain code
01 <chart>
02   <series_list>
03     <series type="Line" data_provider="dpMsft" color="#0066DD">
04       <line_series thickness="2" />
05       <name><![CDATA[MSFT]]></name>
06     </series>
07   </series_list>
09     <technical_indicator type="KeltnerChannels" data_provider="dpMsft" />
11 </chart>
01{
02  seriesList: [
03    {
04      type: "Line",
05      dataProvider: "dpMsft",
06      color: "#0066DD",
07      lineSeries: {
08        thickness: 2
09      },
10      name: "MSFT"
11    }
12  ],
14    {
15      type: "KeltnerChannels",
16      dataProvider: "dpMsft"
17    }
18  ]
19}

As you can see KeltnerChannels type is set to indicator using type attribute, and data_provider attribute specifies data provider with series and indicator data.

Live sample of the chart with Keltner Channels indicator:

Live Sample:  Technical Indicators - Adding Keltner Channels to a Chart

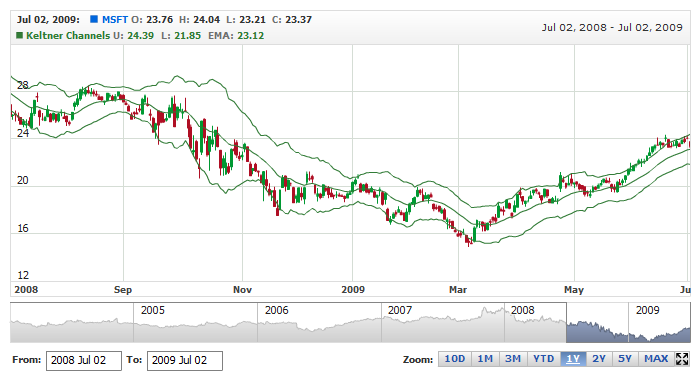
Another Sample shows Keltner Channels indicator with Candlestick series:

Live Sample:  Technical Indicators - Adding Keltner Channels to a Candlestick Chart

to top

Indicator parameters

Keltner Channels indicator has several specific parameters - atr_period, multiplier and ema_period. This parameters are set in <keltner_channels_indicator> node, where all settings for Keltner Channels indicator are set.

Sample XML/JSON for setting parameters:

XML/JSON Syntax
Plain code
01{
02  type: "KeltnerChannels",
03  dataProvider: "dpMsft",
05    atrPeriod: 20,
06    multiplier: 2,
07    emaPeriod: 10
08  }
09}

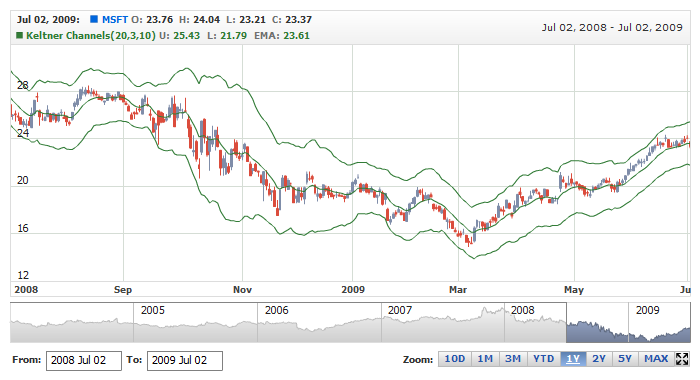
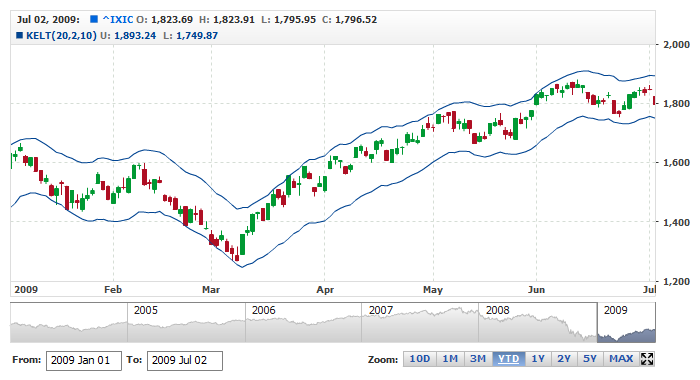
Live sample below shows Keltner Channels(20,2,10):

Live Sample:  Technical Indicators - Keltner Channels Parameters

to top

Visualization using Lines

To visualize and tune visualization of technical indicators AnyChart Stock Component uses the same methods as for the data series.

By default upper channel and lower channel are shown as Lines, but you can use almost any of available series types to show it on the chart, for example, Spline or StepLine types.

Keltner Channels indicator settings are contained in <keltner_channels_indicator> node, also in this node you can put <upper_series> , <lower_series> and <ema_series> subnodes - these nodes define how exactly indicator is displayed on the chart. Nodes are identical to <series> node used to describe data series, so you can do with indicator anything you can do with series.

Sample XML/JSON for changing indicator visualization:

XML/JSON Syntax
Plain code
01 <?xml version="1.0" encoding="UTF-8"?>
02 <stock xmlns="http://anychart.com/products/stock/schemas/1.9.0/schema.xsd">
03   <settings>
04     <charts>
05       <chart>
06         <technical_indicators>
07           <technical_indicator type="KeltnerChannels" data_provider="dp1">
08             <keltner_channels_indicator atr_period="20" multiplier="2" ema_period="10">
09               <upper_series color="#004492" type="Spline">
10                 <line_series thickness="2" />
11                 <name><![CDATA[KELT(20,2,10)]]></name>
12               </upper_series>
13               <lower_series color="#004492" type="Spline">
14                 <line_series thickness="2" />
15               </lower_series>
16               <ema_series color="#004492" type="Spline">
17                 <line_series thickness="2" opacity="0.4" />
18               </ema_series>
19             </keltner_channels_indicator>
20           </technical_indicator>
21         </technical_indicators>
22       </chart>
23     </charts>
24   </settings>
25 </stock>
01{
02  settings: {
03    charts: [
04      {
05        technicalIndicators: [
06          {
07            type: "KeltnerChannels",
08            dataProvider: "dp1",
09            keltnerChannelsIndicator: {
10              atrPeriod: 20,
11              multiplier: 2,
12              emaPeriod: 10,
13              upperSeries: {
14                color: "#004492",
15                type: "Spline",
16                lineSeries: {
17                  thickness: 2
18                },
19                name: "KELT(20,2,10)"
20              },
21              lowerSeries: {
22                color: "#004492",
23                type: "Spline",
24                lineSeries: {
25                  thickness: 2
26                }
27              },
28              emaSeries: {
29                color: "#004492",
30                type: "Spline",
31                lineSeries: {
32                  thickness: 2,
33                  opacity: 0.4
34                }
35              }
36            }
37          }
38        ]
39      }
40    ]
41  }
42}

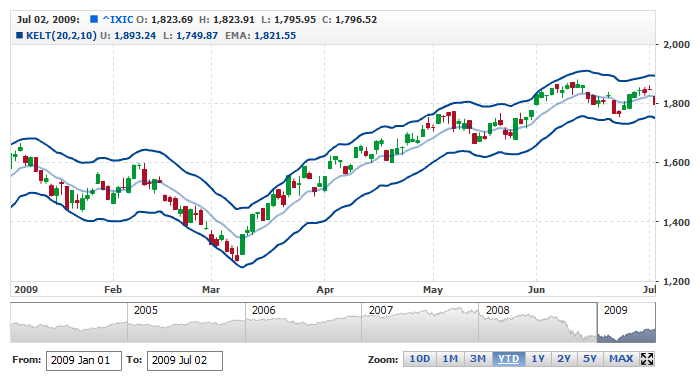
As you can see we changed visualization of upper, lower and ema lines.

Live sample below shows settings described above:

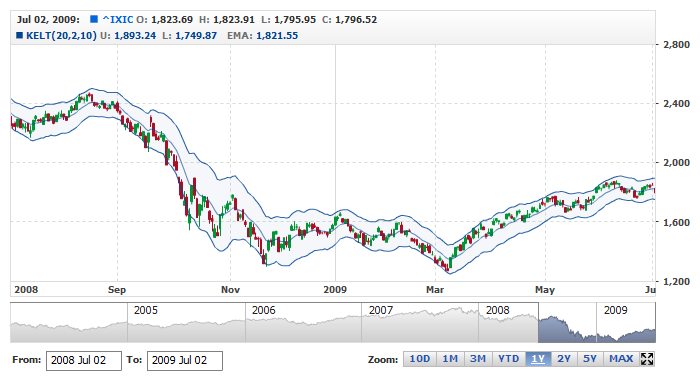
Live Sample:  Technical Indicators - Keltner Channels Visualization Using Lines

to top

Visualization using RangeArea, RangeSplineArea or RangeBar

You can use RangeArea, RangeSplineArea or RangeBar area series to display Keltner Channel indicator's upper and lower channels.

To use these types of series, which need two values to be displayed, you have to enable special mode, as shown below:

XML/JSON Syntax
Plain code
01{
02  type: "KeltnerChannels",
03  dataProvider: "dpMsft",
05    useRangeBasedSeries: true
06  }
07}

As you can see use_range_based_series should be set to true to use this type of Keltner Channels visualization. When this flag is set to true you can use <range_based_series> node to set series type and configure it, along with legend, tooltip and so on. Sample series configuration (color, name, type) is shown below:

XML/JSON Syntax
Plain code
01 <technical_indicator type="KeltnerChannels" data_provider="dpMsft">
03     <range_based_series type="RangeArea" color="#DB2A0E">
04       <name><![CDATA[Keltner Channels(20,2,10)]]></name>
05     </range_based_series>
01{
02  type: "KeltnerChannels",
03  dataProvider: "dpMsft",
05    atrPeriod: 20,
06    multiplier: 2,
07    emaPeriod: 10,
08    useRangeBasedSeries: true,
09    rangeBasedSeries: {
10      type: "RangeArea",
11      color: "#DB2A0E",
12      name: "Keltner Channels(20,2,10)"
13    }
14  }
15}

And here is a live sample with Keltner Channels drawn as RangeArea and legend configured accordingly:

Live Sample:  Technical Indicators - Keltner Channels Visualization using range based series types

to top

Turning off EMA Line

By default EMA line is displayed in Keltner Channels, if you don't want to show it you need to disable elements, that visualize it.

Sample XML/JSON snippet below shows how to do that:

XML/JSON Syntax
Plain code
01 <technical_indicator type="KeltnerChannels" data_provider="dpMsft">
03     <ema_series>
04       <line_series opacity="0" />
05       <marker enabled="false" />
06       <legend_item enabled="false" />
07     </ema_series>
01{
02  type: "KeltnerChannels",
03  dataProvider: "dpMsft",
05    emaSeries: {
06      lineSeries: {
07        opacity: 0
08      },
09      marker: {
10        enabled: false
11      },
12      legendItem: {
13        enabled: false
14      }
15    }
16  }
17}

Live sample below shows Keltner Channels indicator without EMA line:

Live Sample:  Technical Indicators - Keltner Channels turning off central line

to top