Chaikin Money Flow (CMF)
Overview
Developed by Marc Chaikin, Chaikin Money Flow measures the amount of Money Flow Volume over a specific period. Money Flow Volume forms the basis for the Accumulation Distribution Line. Instead of a cumulative total of Money Flow Volume, Chaikin Money Flow simply sums Money Flow Volume for a specific look-back period, typically 20 or 21 days. The resulting indicator fluctuates above/below the zero line just like an oscillator. Chartists weigh the balance of buying or selling pressure with the absolute level of Chaikin Money Flow. Chartists can also look for crosses above or below the zero line to identify changes on money flow.
Mathematical description of the indicator please see at: Mathematical Description of Technical Indicators

Adding indicator
To add any indicator to the chart, you need to use Data Provider with the fields required by the indicator.
When such Data Provider is ready - you can add indicator to the chart.
Preparing Data Provider
Chaikin Money Flow indicator needs Data Provider with High, Low, Close and Volume fields.
Sample XML/JSON of Data Provider, which can be used to create Chaikin Money Flow indicator:
Indicator Declaration
As soon as Data Provider is ready you can add an indicator to a chart.
Chaikin Money Flow indicator is usually
shown on the chart below the chart with data (stock data). So we should declare it in another chart. Learn more about charts and layout in Chart Layout article.
XML/JSON for Chaikin Money Flow declaration, note that there are two charts defined - one is used to show the stock data, and another one contains technical
indicator:
01 |
<?xml version="1.0" encoding="UTF-8"?> |
02 |
<stock xmlns="http://anychart.com/products/stock/schemas/1.9.0/schema.xsd"> |
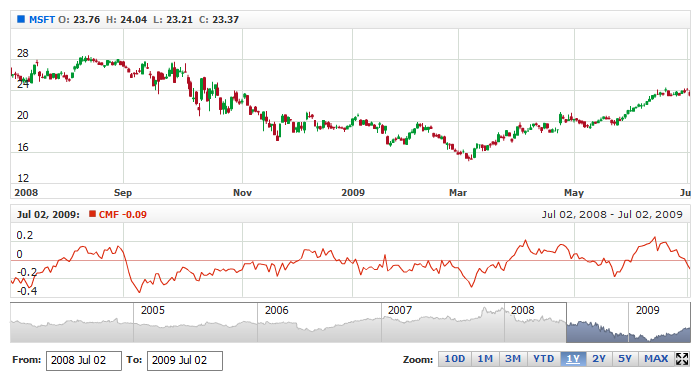
After all things mentioned above are done, you can create a chart with Chaikin Money Flow indicator, see basic Live Sample with it below:
Live Sample: Technical Indicators - Adding Chaikin Money Flow Indicator
Indicator parameters
Chaikin Money Flow has one type-specific parameter - period.
This parameter is set in <cmf_indicator> node, where all settings for Chaikin Money Flow indicator are set.
XML for setting Chaikin Money Flow parameters:
As you can see you just need to set period attribute in <cmf_indicator> node, it accepts any integer greater than 1.
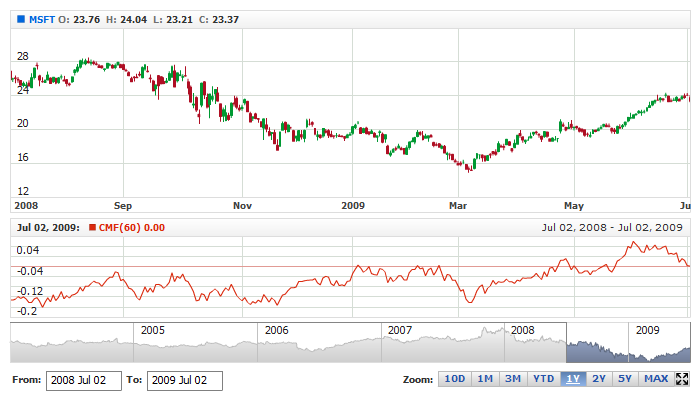
Live sample below shows smoothed CMF(60) indicator:
Live Sample: Technical Indicators - Chaikin Money Flow Parameters
Visualization
To visualize and tune visualization of technical indicators AnyChart Stock Component uses the same methods as for
the data series.
By default Chaikin Money Flow is shown as series of Line type, but you can use almost any of available series types to show it on
the chart - Spline, Area or Stick, for example.
Chaikin Money Flow indicator settings are contained in <cmf_indicator> node, also in this node you can
put <series> subnode - this node defines how exactly indicator is displayed on the chart. This node is
identical to <series> node used to describe data series, so you can do with indicator anything you can do
with series.
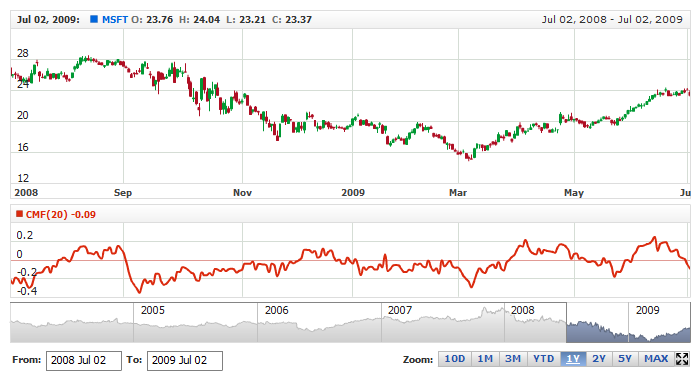
Sample XML for changing indicator visualization:
Live sample below shows settings shown above:
Live Sample: Technical Indicators - Chaikin Money Flow Visualization Settings