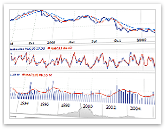
AnyChart Stock Component support 30 fully customizable and automatically calculated technical indicators and overlays, which can be configured to suit your demands. Here is a full list with links to the samples in the chart gallery:
|
|
AnyChart Stock Key FeaturesAnyChart Stock Component is a fully functional solution for solving the broadest range of data visualization problems. The component has numerous advantages over similar software, which excel it as a unique stock and financial charting solution on the market. While working on its functionality, we strove to make it comfortable and easy, so that you could work out the most sophisticated visualization tasks for large sets of financial data with little or no effort. And here is what we've got. Real-Time Data Streaming and Data Manipulations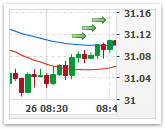
AnyChart Stock provides a full feature set for creating real-time streaming and data manipulation applications. The JavaScript library that comes with the component has methods that allow adding, updating, removing or inserting new data points or range of points. All the operations run fast and smart and allow setting new data without reloading the chart. To learn more about all such functions, please see the article in the documentation: Advanced Interactivity, Rich Zooming, Scrolling and Navigation Options
AnyChart Stock is fully interactive! All of its navigation elements meet all the industry's usability standards and are very comfortable in use. The primary navigation control is the so-called Scroller. Using Scroller, which displays a series' thumbnail in its own background, you can instantly jump to the area of your interest. Besides that, you can zoom and scroll the data almost every possible way. Combined with other navigation elements, Scroller resolves all possible navigation issues and dramatically improves user experience! Drawing Tools for Technical Analysis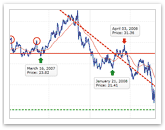
A complete list of drawing tools, giving end users an ability to add drawings to a chart such as Line segment, Ray, Trend line, Vertical Line, Horizontal Line, Rectangle, Ellipse, Triangle, Trend channel, Andrew's pitchfork, Fibonacci fan, Fibonacci arc, Fibonacci retracement, Fibonacci time-zones, Buy/Sell signals, Custom text labels and so on. All annotations can be added by a user or hardcoded in XML/JSON, full add/remove/edit and visual customization support. Check out the live demo: Attractive and Flexible Visual Settings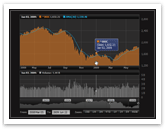
All the visual elements of AnyChart Stock Component are configured to provide the best user experience: mild and clear colors, intuitive controls, and so on. At the same time, you have the power to quickly customize almost every part of a chart: change colors, fonts, sizes and shapes. The extensive documentation covers every aspect of chart elements configuration. We also provide the defaults and templates system, which eases up the configuration process and allows reusing configuration sets you have created earlier. Fully Configurable Localization
AnyChart Stock Component allows localizing the appearance of date, time and numbers to suit the region's language and cultural peculiarities. By default, date, time and numbers are localized according to the North American (US) standards, but that can be easily changed to suit any other region or culture. To make the localization even easier, we have created a special utility that allows obtaining the required regional configuration in a matter of minutes. Take a look at this utility and feel the power of AnyChart Stock's Localization options: Show Significant Events Using Special Markers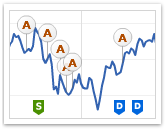
One of the most exciting features of our component are Event Markers - a special type of chart markers that are created to provide best experience in showing Key Developments, Dividends, Splits, Insider Transactions, Analyst Opinion Changes or any other events on Financial charts. Event markers can be bound to a chart series or to the timeline; four special marker shapes are available. The stacking and merging systems allow to put as many markers as necessary on a chart, while keeping the chart clean and readable. Learn more about Event Markers at: Export Chart as JPG Image, PNG Image or PDF
Any rendered chart can be exported by end user or application to any of the supported formats; the export can accessed either through the chart's context menu or through the program code. You can save a chart as a JPG image, PNG image, PDF document with a static image in it or as an Interactive PDF. Interactive PDF is a document, which contains a built-in Flash Player, and the viewer allows scrolling and manipulating the chart the same way as that is done on an HTML page. Fourteen Chart Types, All Combinable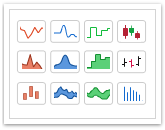
AnyChart Stock supports 14 chart (series) types; all those types are combinable and can be displayed on one or several plots at the same time. Here is a full list of supported types with links to the chart gallery: Performance Charts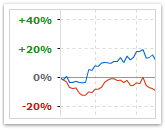
AnyChart Stock supports the so-called "Comparison Mode" to show Performance Charts - a very important feature for showing stocks-related information that allows comparing changes in series values. You can show both absolute and percent changes, define static or dynamic comparison start date and reflect changes direction in legend or tooltip using colors or icons. You can find the demonstration of this feature at: Full Screen Mode
Viewing large amounts of data is very comfortable in the Full Screen Mode - AnyChart Stock lets you magnify a chart and watch it on a full screen. The Full Screen Mode turns on via the "Show Full Screen..." item on the context menu. Please note that the full screen feature has a number of configurable resizing modes, so you can fine-tune it to meet your needs. Chart Printing
AnyChart Stock provides multifunctional printing that allows printing out current chart state. A chart can be printed via the "Print Chart.." item on the context menu or through a special Java Script API method. For both ways, you can tune the scaling mode to get the desired appearance for the printed chart. Rich JavaScript API
AnyChart Stock comes with a special JavaScript library built to make the use of the component in a Rich Internet Application easy and fast. The library controls all the aspects of the interaction between the chart, the HTML page, and server. Chart embedding, handling events, getting data from chart, exporting chart, accessing chart object model - all these features is a minor part of the JS API's potential. Learn more about AnyChart JavaScript API at: JSON-Based Configuration
One of the unique and very useful features of the component is the ability to configure chart using JavaScript Object Notation (JSON). This function is great for working with a chart within an HTML page, especially when the developers prefer fully JavaScript-based solutions. Also, JSON is very handy for updating chart configuration in real time using the chart object model. XML Schema and XML-Based Configuration
AnyChart Stock's basic configuration format is XML. XML is a very comfortable format to work with, and you can easily create and alter it both on the client and the server side. We provide XML Schema for the AnyChart Stock XML format - it eases up creating schema-based wrappers or editing XML in XML editors. Chart Object Model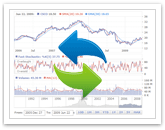
A special thing about AnyChart Stock that it provides the ability to access the chart object model, which means you can change any of a chart's initial settings in real time, almost always instantly. The chart object model makes the development much easier and enables you to make your application even more interactive! Any loaded and rendered chart's settings can be obtained in the form of a JSON object using Java Script API; this configuration object can be read, modified and passed back to the component to apply the new settings. You can find a lot of samples that demonstrate and explain this technique at: Logarithmic Scale
Logarithmic Scale is irreplaceable when we talk about large scaled values, which cannot be avoided in today's financial charting, so AnyChart Stock supports it in full! The scale has several modes for displaying negative values; those modes allow using performance charts - when the percentage or absolute changes are shown instead of the absolute security prices, which can be both positive and negative. Multiple Y Axes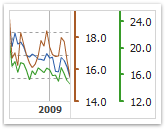
Several Y (Value) Axes are a very important feature, which allows solving a lot of tasks. AnyChart Stock has the very flexible system for adding extra Y axes to a chart, so you wouldn't have any problems with that. The component supports any number of additional axes, with one or multiple series or technical indicators bound to them. The axes can also have no data binding and be synchronized or not synchronized with other axes on the chart. Smart Timescale (X Axis) Labels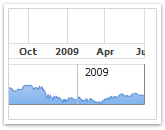
Smart timescale labeling algorithms analyze selected time range and always show the optimal number of labels, properly formatting those to make them readable. Rich label formatting options for both major and minor labels give you the ability to display the timescale in any desired format! Y Axis Line Markers and Trend Lines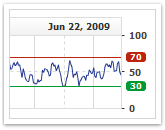
The Y Axis Line Markers mechanism allows plotting trend lines and significant thresholds. Each Y Axis can have any number of such markers, each bound to some value. Markers can be displayed as a solid or dashed line, with one or several labels. Axis Markers have a special option that can make them always visible (change axis range calculation mode). Y Axis Range Markers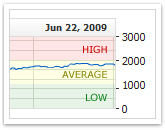
Y Axis Range Marker is a visual element that consists of a solid or gradient fill and two lines that are bound to the two values on the axis. These elements mark a certain axis range with some special meaning, like, for example, marking thresholds. Ranges are fully customizable - lines, fill and so on. You can add any number of labels on the markers that would help to explain the meaning of the marked range. Timescale (X Axis) Markers
Timescale Markers are used for highlighting some significant date on the timeline. Any chart panel can have any number of timescale markers, and any timescale marker can have any number of labels. Timescale (X Axis) Range Markers
Any period of time on the plot can be marked with Timescale Range Markers. You would have to set the start and end date and define how you would like this range to appear. Like any other axis markers, the ranges can have any number of labels - with customizable font, text and background. Multiple Chart Panels with One TimeScale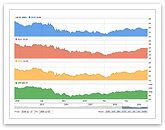
With AnyChart Stock, you can display several chart panels (plots) that are synchronized with one common timescale. This approach enables you to compare different data series and display technical indicators and overlays properly. Each chart panel has its own set of value axes, own legend and other elements, but the timescale is always common. The panels can be hidden, changed or shown at any time. Please refer to AnyChart Stock Documentation to learn more. Crosshair, Date Highlighter and Value Highlighter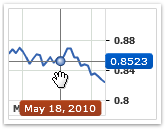
To give user relevant information on the data under the muse pointer, you can take advantage of Crosshair. AnyChart Stock features two separate special elements: Date Highlighter and Value Highlighter. These two elements enable you to create a Crosshair element or simply highlight the date or value under the mouse pointer. Great Chart Tooltips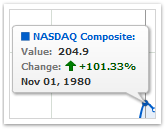
Tooltips is one of the best ways to present actual information to a chart viewer and one of the best things in interactive charting solutions. With AnyChart Stock, you can display personalized tooltips for any series that is being displayed. HTML formatting and a special token system allow displaying data in almost any desired format! Grouped Tooltip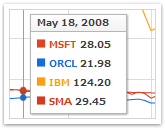
When showing several series and chart panels, it may be helpful to put all the actual chart data in one place and display a so-called Grouped Tooltip that aggregates a lot of data and shows it in a table-like form. This element may be a good alternative to separated tooltips; besides, it is fully configurable, just as any other element in AnyChart Stock. Smart Legend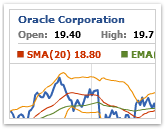
One of the basic elements of a chart is its legend, which displays all actual chart information as a neat information bar at the top of the chart. Legend has a lot of features:
The element can show a lot of items, include line breaks and parse HTML formatting to achieve great visualization results! Advanced Date-Time Formatting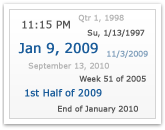
Whenever you display Date-Time values in AnyChart Stock - you are always in the full control over the way these values are displayed. To make this possible, we have implemented a special formatting tokens mechanism, which allows localizing and customizing any date-time value. The component supports over 40 tokens that allow defining any pattern for the appearance of date-time values and comes with predefined formatting for all of its elements. Learn more about Date-Time formatting at: Advanced Number Formatting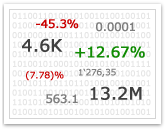
Values are the core of a chart, and the ability to show values in a desired format is crucial for any data visualization task. AnyChart Stock provides a flexible number formatting mechanism, which is able to meet any needs. Whenever you make a chart element display any number, you can format it the way you want by using a set of special formatting tokens. The formatting options are numerous: multi-level scaling to display large numbers in a short notation, different styles for negative and positive values, number of decimal digits, and a lot more. Learn more about number formatting at: |