|
|
Tutorial for using AnyChart with JSPAnyChart Flash Charting Component is a flexible Adobe Flash based solution that allows you to create interactive and great looking flash charts and dashboards. It is a cross-browser and cross-platform charting solution intended for everybody who deals with creation of dashboard, reporting, analytics, statistical, financial or any other data visualization solutions. Please see more information about AnyChart at: A lot of technologies allow developers to use Flash based products, but there are specific issues in each case. AnyChart Team have tried to creates samples that make the start of implementation of AnyChart easier and understandable. This particular sample explains how to use AnyChart Flash Charts, Maps, Gauges and Dashboards with JSP (Java Server Pages). If you want to use AnyChart with JSP you can start with downloading the following library:
You can also download JAR source code and modify/compile it according to your needs:
Simple Chart created using AnyChart and JSP
1. IntroductionAnyChart is a Flash based solution for charting data and it accepts data in XML format. AnyChart for JSP Integration Library is an integration kit that helps to embed AnyChart into JSP pages.
2. Installation1. Put AnyChart.jar into WEB-INF/lib folder of web-application project.
<filter> <filter-name>AnyChart Resources</filter-name> <display-name>AnyChart static resources filter</display-name> <description> This servlet filter is intended for catch http request to static AnyChart Component resources (AnyChart.js and AnyChart.swf) </description> <filter-class>com.anychart.servlet.ResourceFilter</filter-class> </filter> <filter-mapping> <filter-name>AnyChart Resources</filter-name> <url-pattern>/*</url-pattern> </filter-mapping> Sample of web.xml for 2.3 version:
<?xml version="1.0" encoding="UTF-8"?>
<!DOCTYPE web-app PUBLIC "-//Sun Microsystems, Inc.//DTD Web Application 2.3//EN" "http://java.sun.com/dtd/web-app_2_3.dtd"> <web-app> <filter> <filter-name>AnyChart Resources</filter-name> <display-name>AnyChart static resources filter</display-name> <description> This servlet filter is intended for catch http request to static AnyChart Component resources (AnyChart.js and AnyChart.swf) </description> <filter-class>com.anychart.servlet.ResourceFilter</filter-class> </filter> <filter-mapping> <filter-name>AnyChart Resources</filter-name> <url-pattern>/*</url-pattern> </filter-mapping> </web-app>
3. Basic UsageAnyChart accepts data in XML format. To put AnyChart into JSP page you should use chart tag.
You can use Expression Language (EL) in tag attributes and tag body. To add AnyChart tag library int JSP page you add the following to the top::
<%@ taglib prefix="any" uri="http://www.anychart.com" %>
3.1. <any:chart /> TagAttributes:
You can not only set url path in xmlFile attribute, but include XML directly in tag body in JSP page, you can omit root tag <anychart></anychart> in this case.
3.2. XML StructureAs it is already said above, AnyChart accepts settings in XML. The very basic XML looks like that:
<anychart>
<charts> <chart> <chart_settings> <title> <text><![CDATA[Product sales by Month]]></text> </title> <axes> <x_axis> <title> <text><![CDATA[Months]]></text> </title> </x_axis> <y_axis> <title> <text><![CDATA[Sales]]></text> </title> </y_axis> </axes> </chart_settings> <data> <series> <point name="Jan" y="21" /> <point name="Feb" y="32" /> <point name="Mar" y="43" /> <point name="Apr" y="54" /> </series> </data> </chart> </charts> </anychart> Detailed information about AnyChart XML you can find in basic AnyChart Documentation:
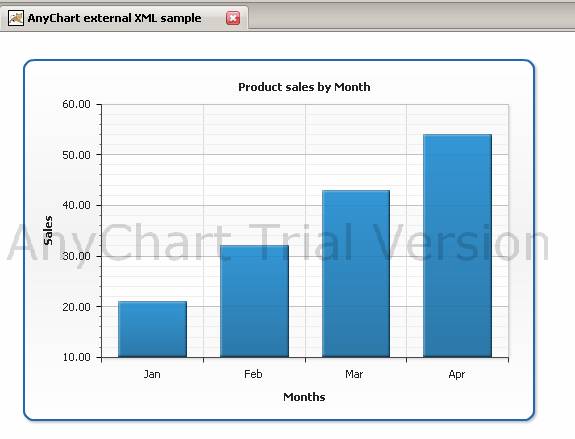
3.3. Basic usage with external XML dataAdd AnyChart.jar to the project and register AnyChart Filter in web.xml as it is shown in 1. Installation. Create XML data.xml with data and settings for AnyChart (copy XML from 3.2. XML Structure), place it to the same folder where your JSP page is located. Add AnyChart tag library import to you JSP page: <%@ taglib prefix="any" uri="http://www.anychart.com" %>
In JSP body add<any:chart /> with sizes and chart XML file settings: <any:chart width="550" height="400" xmlFile="./data.xml" />
JSP page will look like that now: <%@ page contentType="text/html;charset=UTF-8" language="java" %>
<%@ taglib prefix="any" uri="http://www.anychart.com" %> <html> <head> <title>AnyChart external data sample</title> </head> <body> <any:chart width="550px" height="400px" xmlFile="./data.xml" /> </body> </html> If you launch a JSP page now you should see the following:
Download this sample:
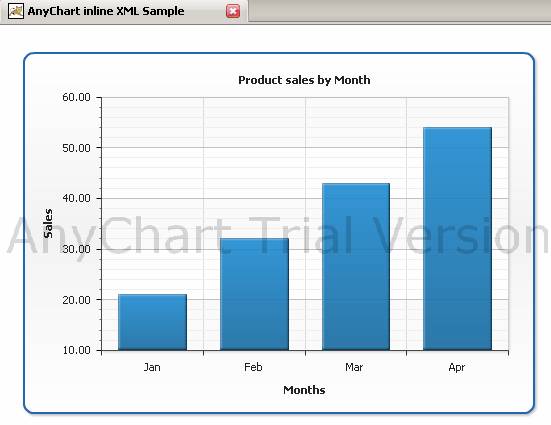
3.4. Basic usage with inline XMLYou can embed XML setting directly into JSP page. To do this: Create XML with data and settings for AnyChart (copy XML from 3.2. XML Structure). Add AnyChart tag library import to you JSP page: <%@ taglib prefix="any" uri="http://www.anychart.com" %>
In JSP body add<any:chart /> with sizes: <any:chart width="550" height="400"></any:chart>
Add XML as a subnode of <any:chart />. <%@ page contentType="text/html;charset=UTF-8" language="java" %>
<%@ taglib prefix="any" uri="http://www.anychart.com" %> <html> <head><title>AnyChart inline XML Sample</title></head> <body> <any:chart width="550" height="400"> <anychart> <charts> <chart> <chart_settings> <title> <text><![CDATA[Product sales by Month]]></text> </title> <axes> <x_axis> <title> <text><![CDATA[Months]]></text> </title> </x_axis> <y_axis> <title> <text><![CDATA[Sales]]></text> </title> </y_axis> </axes> </chart_settings> <data> <series> <point name="Jan" y="21" /> <point name="Feb" y="32" /> <point name="Mar" y="43" /> <point name="Apr" y="54" /> </series> </data> </chart> </charts> </anychart> </any:chart> </body> </html> As a result you should see a chart like this: Download this sample:
4. Charting dynamic dataAdd AnyChart.jar to the project and register AnyChart Filter in web.xml as it is shown in 1. Installation. To create chart that shows dynamic data we recommend you to create AnyChart XML with a separate JSP page with content-type:text/xml
4.1. Single series dataLets chart this sample data set:
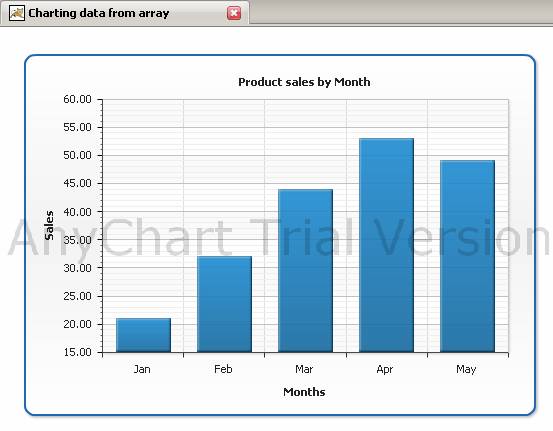
4.1.1 Single series data with using Java code in JSPWe will put it into JSP into Array and convert into AnyChart XML - data.jsp <%@ page contentType="text/xml;charset=UTF-8" language="java" %>
<% String[][] sales = new String[5][2]; //Sales data by month //[0] = month name //[1] = sales sales[0][0] = "Jan"; sales[0][1] = "21"; sales[1][0] = "Feb"; sales[1][1] = "32"; sales[2][0] = "Mar"; sales[2][1] = "44"; sales[3][0] = "Apr"; sales[3][1] = "53"; sales[4][0] = "May"; sales[4][1] = "49"; String salesDataStr = "<series>"; for (String[] sale : sales) { salesDataStr += "<point name=\"" + sale[0] + "\" y=\"" + sale[1] + "\" />"; } salesDataStr += "</series>"; %> <anychart> <charts> <chart> <chart_settings> <title> <text><![CDATA[Product sales by Month]]></text> </title> <axes> <x_axis> <title> <text><![CDATA[Months]]></text> </title> </x_axis> <y_axis> <title> <text><![CDATA[Sales]]></text> </title> </y_axis> </axes> </chart_settings> <data> <%=salesDataStr%> </data> </chart> </charts> </anychart> index.jsp with the chart should be created as it is described in 3.3. Basic Usage with external XML : <%@ taglib prefix="any" uri="http://www.anychart.com" %>
<%@ page contentType="text/html;charset=UTF-8" language="java" %> <html> <head> <title>Charting data from array</title> </head> <body> <any:chart width="550" height="400" xmlFile="./data.jsp" /> </body> </html> As a result you should see : Download this sample: 4.1.1 Single series data with Bean and STLLets create a class for that outputs data, required for XML:
package com.anychart.samples;
import java.util.HashMap; public class SingleSeriesSalesDataSample { public HashMap<String, String> getSales() { HashMap<String,String> sales = new HashMap<String, String>(5); //Sales data by month sales.put("Jan","21"); sales.put("Feb","32"); sales.put("Mar","44"); sales.put("Apr","53"); sales.put("May","49"); return sales; } } Lets create data.jsp that creates XML:
<%@ page contentType="text/xml;charset=UTF-8" language="java" isELIgnored="false" %>
<%@ taglib prefix="c" uri="http://java.sun.com/jsp/jstl/core" %> <jsp:useBean id="salesBean" class="com.anychart.samples.SingleSeriesSalesDataSample" /> <anychart> <charts> <chart> <chart_settings> <title> <text><![CDATA[Product sales by Month]]></text> </title> <axes> <x_axis> <title> <text><![CDATA[Months]]></text> </title> </x_axis> <y_axis> <title> <text><![CDATA[Sales]]></text> </title> </y_axis> </axes> </chart_settings> <data> <series name="Products Report"> <c:forEach var="item" items="${salesBean.sales}"> <point name="${item.key}" y="${item.value}" /> </c:forEach> </series> </data> </chart> </charts> </anychart> index.jsp with the chart should be created as it is described in 3.3. Basic Usage with external XML : <%@ taglib prefix="any" uri="http://www.anychart.com" %>
<%@ page contentType="text/html;charset=UTF-8" language="java" %> <html> <head> <title>Charting data from array</title> </head> <body> <any:chart width="550" height="400" xmlFile="./data.jsp" /> </body> </html> As a result you should see : Download this sample:
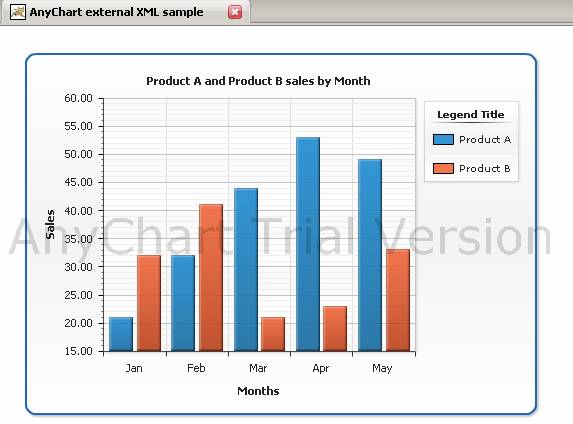
4.2. Multi series dataAdd AnyChart.jar to the project and register AnyChart Filter in web.xml as it is shown in 1. Installation.Lets now chart multi-series data like shown below:
We will put it into Array and convert into AnyChart XML: <%@ page contentType="text/xml;charset=UTF-8" language="java" %>
<% String[][] sales = new String[5][3]; //Sales data by month //[0] = Month name //[1] = Produc A sales //[2] = Product B sales sales[0][0] = "Jan"; sales[0][1] = "21"; sales[0][2] = "32"; sales[1][0] = "Feb"; sales[2][0] = "Mar"; sales[3][0] = "Apr"; sales[4][0] = "May"; String productASeries = "<series name=\"Product A\">"; for (String[] sale : sales) { String salesDataStr = productASeries + productBSeries; index.jsp with the chart should be created as it is described in 3.3. Basic Usage with external XML : <%@ taglib prefix="any" uri="http://www.anychart.com" %>
<%@ page contentType="text/html;charset=UTF-8" language="java" %> <html> <head> <title>Charting data from array</title> </head> <body> <any:chart width="550" height="400" xmlFile="./multiSeriesData.jsp" /> </body> </html> As a result you should see this chart: Download this sample:
5. Charting data from databaseLets assume we have two tables in our database: 1. anychart_sample_products
2. anychart_sample_orders
The task is to show summary sales volume per product to compare them.
5.1 Charting data from database using JSTL SQLdata.jsp code will look as follows (replace localhost with your server if needed): <%@ page contentType="text/xml; charset=UTF-8" isELIgnored ="false" %> index.jsp with the chart should be created as it is described in 3.3. Basic Usage with external XML : <%@ taglib prefix="any" uri="http://www.anychart.com" %>
<%@ page contentType="text/html;charset=UTF-8" language="java" %> <html> <head> <title>Charting data from array</title> </head> <body> <any:chart width="550" height="400" xmlFile="./data.jsp" /> </body> </html> Download this sample:
5.2 Charting data from database using BeanLets create Bean for getting records from database: package com.anychart.samples;
import java.sql.*; import java.util.*; /** * Example bean for getting data from MySQL database */ public class ProductReportsBean { /** * Class for store one result from query */ public static class Report { private String name; private int value; /** * @return the name */ public String getName() { return name; } /** * @return the value */ public int getValue() { return value; } } private static final String url = "jdbc:mysql://localhost/anychart_sample_database?useUnicode=true&characterEncoding=utf8"; private static final String dbUser = "root"; private static final String dbPass = "1"; private static final String sqlquery = "select p.name as name, sum(o.volume) as value " + "from anychart_sample_products p, anychart_sample_orders o " + "where p.id = o.product_id group by p.name"; public List getReportsList() throws Exception { Connection conn = null; Statement st = null; ResultSet rs = null; try { Class.forName("com.mysql.jdbc.Driver"); conn = DriverManager.getConnection(url, dbUser, dbPass); st = conn.createStatement(); rs = st.executeQuery(sqlquery); List res = new ArrayList(); while (rs.next()) { Report r = new Report(); r.name = rs.getString("name"); r.value = rs.getInt("value"); res.add(r); } return res; } finally { try { if (rs != null) { rs.close(); } if (st != null) { st.close(); } } finally { if (conn != null) { conn.close(); } } } } } data.jsp will look as follows: <%@ page contentType="text/xml; charset=UTF-8" isELIgnored="false" %> index.jsp with the chart should be created as it is described in 3.3. Basic Usage with external XML : <%@ taglib prefix="any" uri="http://www.anychart.com" %>
<%@ page contentType="text/html;charset=UTF-8" language="java" %> <html> <head> <title>Charting data from array</title> </head> <body> <any:chart width="550" height="400" xmlFile="./data.jsp" /> </body> </html> Download this sample:
6. Using GaugesAdd Gauge XML as a subnode of <any:gauge />. <%@ page contentType="text/html;charset=UTF-8" language="java" %>
<%@ taglib prefix="any" uri="http://www.anychart.com" %> <html> <head><title>AnyChart Gauge inline XML Sample</title></head> <body> <any:chart width="550" height="400"> <gauges> <gauge> <circular> <pointers> <pointer value="21" /> </pointers> </circular> </gauge> </gauges> </any:chart> </body> </html>
To learn more about AnyChart, get User's Guide and XML Reference:
|