|
|
Using AnyChart with PowerPoint presentationsContentsIntroAnyChart is a flexible component for creation charts not only for Web, you can use AnyChart in PowerPoint as well. We will show how to embed chart into a presentation in the following tutorial. It is assumed that you've already created an XML file that configures the chart.
Create and Save PowerPoint presentationCreate new PowerPoint presentation and save it to some folder on your computer. You can store XML and SWF files where you want to. In our sample we will use the doughnut chart: 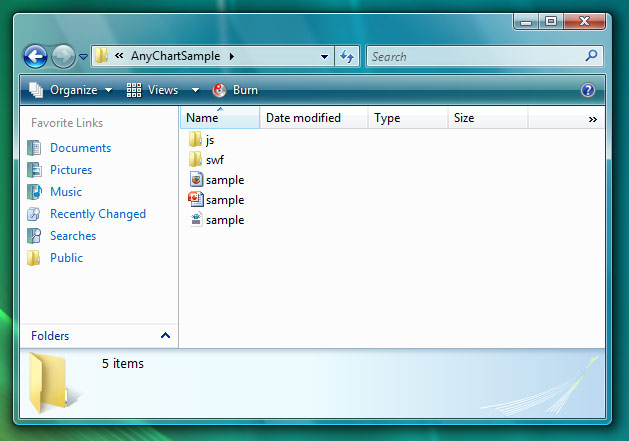
Also we've configured sample.xml file to show our data, and checked it in the browser. This file is also saved in our presentations folder. 
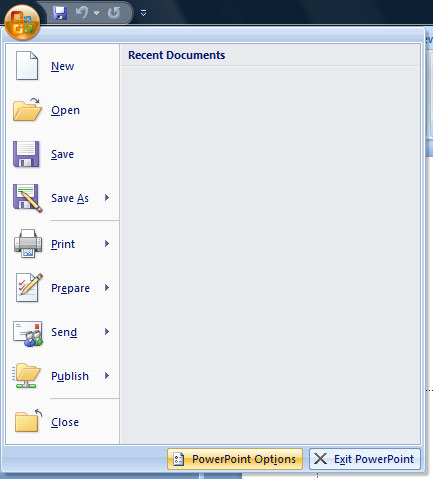
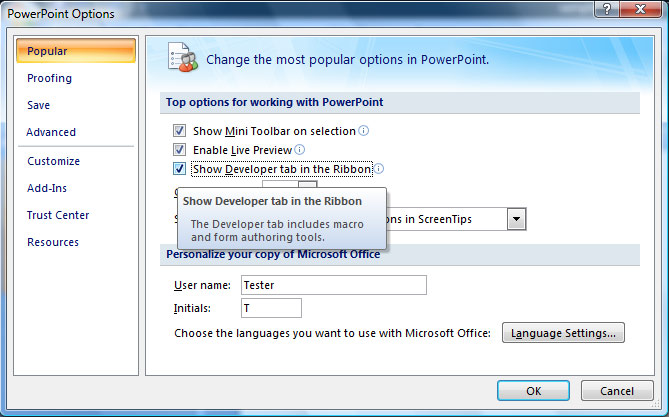
Insert Flash object into presentationClick the Microsoft Office Button, and then click PowerPoint Options Click Popular, and then under Top options for working with PowerPoint, select the Show Developer tab in the Ribbon check box, and then click OK.
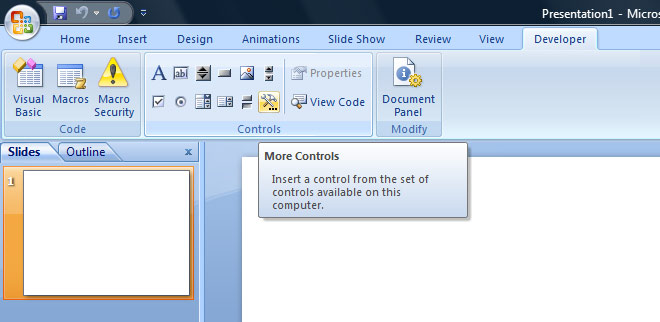
On the Developer tab, in the Controls group, click More Controls
Locate More Controls button in that toolbar and choose Shockwave Flash Object:
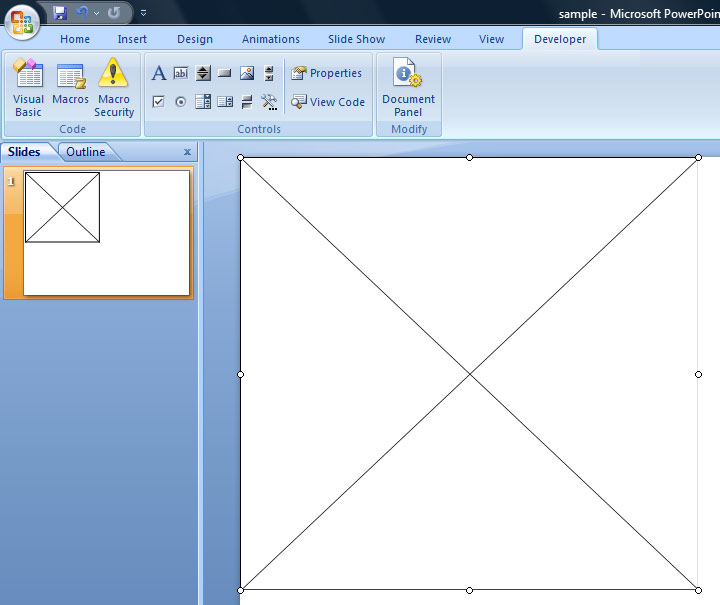
Then click on your slide and adjust the size of the chart. You will see something like that:
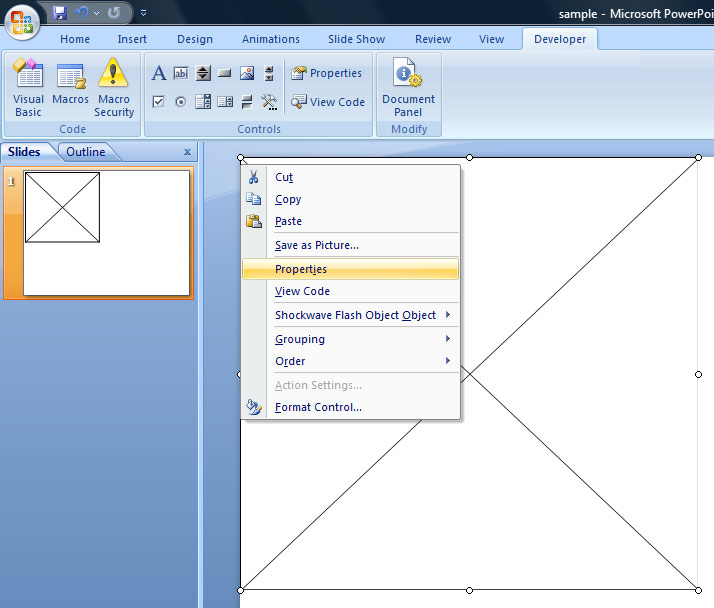
Right-click on the object and select Properties:
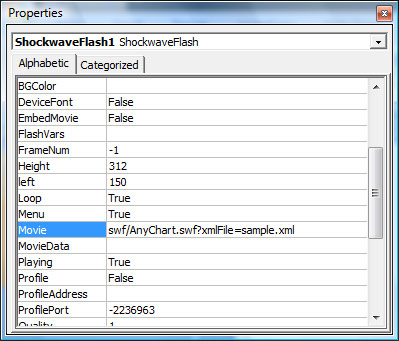
On the Alphabetic tab, click the Movie property:
As you can see on the picture above you need to provide an SWF file name (Movie URL), followed by ?XMLFile=sample.xml In our sample we use swf/AnyChart.swf to show data. All settings are stored in sample.xml, so we've set Movie URL to: swf/AnyChart.swf?XMLFile=sample.xml After pasting Movie close the Properties window. The flash movie will not be shown in PPT immediately. You should view presentation (click F5 or Slide Show->From beginning). Note:
FinalHere it is - we've added AnyChart Flash Charts into PowerPoint presentation.
You can download this sample from here: Download zipped sample.
|