AnyChart Version History
AnyChart Roadmap Upcoming Versions Schedule
AnyChart version 7.4.0Released Mar 30th, 2015
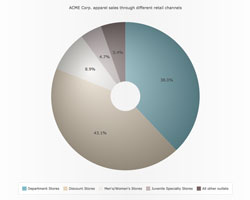
Pie/Donut Aqua Style
Aqua Style for Pie/Donut charts is a renewed gradient fill style which has become very popular among our users since AnyChart 5.0.
Take a look at Gallery sample >>
Other Features and Improvements:
- DVF-1332 Soft Minimum/Maximum feature for Linear, Log and DateTime Scales.
- DVF-1208 Text Formatters functions reworked, performance improved.
- DVF-1326 The anychart.bubble and anychart.marker constructors now use Scatter Chart instead of Cartesian Chart.
Bugfixes:
- DVF-1210 Problems with drawing legend separators.
- DVF-1167 Multiple line-breaks (\n\n) in all texts bugfix.
- DVF-1251 toJson() serialization bugfix.
- DVF-1227 Bullet Chart data streaming bugfix.
- DVF-1287 Problems with string data in DataSet.
- DVF-1232 The hAlign and vAlign values are normalized properly now.
- DVF-1275 Problems with disabling series tooltip bugfix.
AnyChart version 7.3.1Released Jan 21st, 2015
Bugfixes:
- DVF-1211 Problems with updating data points on Pie Charts.
- DVF-1215 Problems with updating legend items and appending series in Scatter/Cartesian/Radar/Polar Charts.
AnyChart version 7.3.0Released Dec 15th, 2014
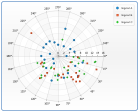
Polar Chart feature
Polar chart plot allows to draw scatter chart using polar coordinate system, which is is a two-dimensional coordinate system in which each point on a plane is determined by a distance from a fixed point and an angle from a fixed direction.
Read more about Polar Chart >>
Take a look at Gallery sample >>
New Features and Improvements:
- DVF-767 SVG Export Option.
- DVF-1187 Pie with one point display.
- DVF-1166 Charts with no data doesn't generate an error now.
Bugfixes:
- DVF-1170 textMarker anchors problem.
- DVF-1167 Pallette problems.
- DVF-1162 Long labels wrapping issue.
- DVF-1160 Pie outside labels bugfix.
- DVF-1135 Rendering problems in IE11 fixed.
- DVF-1134 Chart resize bugfix.
- DVF-1113 Legend series marker in legend problem.
- DVF-1100 Outside pie labels in a single-point.
- DVF-1086 Min/max settings in Bubble chart.
- DVF-1061 negativeHatchFill in Bubble series problem.
- DVF-1056 Container resize problem with JQuery UI.
- DVF-1043 .dispose() method issues.
- DVF-988 Hidden containers problem.
AnyChart version 7.2.0Released Oct 23th, 2014
Features:
- DVF-532 Table Layout.
- DVF-815 Add/Remove/Updatet Operations.
- DVF-823 Bullet Chart Type.
Improvements:
- DVF-772 Performance improvements.
- DVF-933 Framework Warnings and Errors Improvement.
Bug fixes:
- DVF-944 Z-index bugfix.
- DVF-946 Marker issues in DateTime scales.
- DVF-983 FireFox 32 and IE11 chart bugfix.
AnyChart version 7.1.1Released Sep 18th, 2014
Bug fixes:
- DVF-752 SVG namespace was duplicated declaration in IE.
- DVF-808 AnyChart conflicted with prototypejs library.
- DVF-927 After using the chart.draw() method, the values for the text, line, and range markers
were not recalculated.
- DVF-926 The legend height was sometimes calculated incorrectly.
- DVF-919 Rendering problems in IE8.
- DVF-918 The grid was always drawn over the chart series.
- DVF-917 After turning off series, markers were not turned off.
- DVF-916 The marker stroke did not get the series settings.
- DVF-915 Series label setter did not work.
- DVF-912 There were problems with the X-axis DateTime scale.
- DVF-899 There were a problem with the markers in the legend icon.
- DVF-897 TextMarker was positioned incorrectly.
- DVF-896 Area overlapped other series.
- DVF-895 The xAxis(index, value) and yAxis(index, value) methods did not work.
- DVF-842 The OHLC series had an incorrect color if data were set using CSV.
- DVF-764 After the draw() event, changes were not applied to the axis title.
- DVF-762 Label settings override did not work in the Pie Chart data.
- DVF-754 There were bugs with the hatch fill in cartesian series.
AnyChart version 7.1.0Released Aug 29th, 2014
Features:
- Pie Chart labels outside position support
- Axes labels stagger position support
- Legend items icon customization
- Legend tooltip feature
- Axes labels stagger position support
Improvements:
- Series formatting improvement
Bug fixes:
- DVF-808 AnyChart does not work
correctly with prototypejs.
AnyChart version 7.0.0 - New generation of AnyChart products.Released July 3th, 2014
- Consistent and Flexible JavaScript API.
- New Built-in Graphics engine.
- XML, JSON, CSV Data formats support.
- Dashboard oriented data model.
- Significant performance improvements.
- IE6+ Support.
AnyChart version 6.2.0 Features Released December 6th, 2013
New features:
- SUP-442 Double Click event support in HTML5 and Flash engine.
Improvements:
- Rendering performance improvement for HTML5 engine in Internet Explorer 6.x, 7.x, 8.x.
Bug fixes:
- DVF-162 Pie/Doughnut exploded settings bug fixed.
- DVF-107 Scale minimum value calculation bug fixed.
AnyChart version 6.1.0 Features Released September 20th, 2013
New features:
- DVF-6 Internet Explorer 6.x, 7.x, 8.x support added to HTML5 engine.
Improvements:
- DVF-7 Texts rendering is improved in HTML5 engine.
Bug fixes:
- AFJ-387 Custom labels in Gauges no longer break rendering in HTML5 Engine.
- AFJ-386 Cone series in stacked mode with first zero value no longer breaks rendering in
Flash Engine.
- AFJ-385 Axes border issues are solved in HTML5 Engine.
- AFJ-383 {%YPercentOfCategory}, {%YSum}, {%YMax}, {%YMin}, {%YPercentOfCategory} tokens
are now correctly calculated in HTML5 engine.
- AFJ-382 Gauge tickmarks issues are solved in HTML5 Engine.
- DVF-108 ChartUpdate actions with external chart data now correctly work in all browsers.
AnyChart version 6.0.12 Features Released April 26th, 2013
New features:
- AFJ-261 3D Plot is added to HTML5 Engine.
- AFJ-233 CSV Support is added to HTML5 Engine.
Improvements:
- AFJ-277 Stacked Bar and Area behavior with Missing Values is improved.
- AFJ-274 Stacked Bar behavior with Zero and Negative Values is improved.
Bug fixes:
- AFJ-272 Pie label incorrect positioning is fixed in HTML5 Engine.
- AFJ-380 Chart .remove() method now correctly works in IE9.
- AFJ-259 HTML5 Engine now treats empty text nodes correctly.
- AFJ-240 {%DataPlotYMin} and {%DataPlotYMax} tokens are now correctly calculated in HTML5
Engine.
- AFJ-271, AFJ-265 Custom legend Icon settings no longer breaks rendering in HTML5 Engine.
- AFJ-267 Empty data node in template is now correctly treated in HTML5 Engine.
- AFJ-249 Backgroundless Charts Size is now correctly calculated in HTML5 Engine.
- AFJ-251 Gauge Frame Gradient Issues are solved in HTML5 Engine.
- AFJ-375 Outside labels positioning is fixed in HTML5 Engine.
AnyChart version 6.0.11 Features Released November 30th, 2012
New features:
- AFJ-182 Circular gauges are fully implemented in the HTML5 engine.
- AFJ-216 Label gauges are implemented in the HTML5 engine.
- AFJ-216 Indicator and Bulb gauges are implemented in the HTML5 engine.
- AFJ-213 Radar/Polar plots are implemented in the HTML5 engine.
Bug fixes:
- Flash engine:
- SUP-294 Flex component no longer throws an error when the legend is enabled in
charts.
- SUP-376 Maps are now displayed in Chrome with the Pepper Flash plugin.
- SUP-328 Marker series is now properly animated.
- SUP-332 Pie series opacity issues are fixed.
- SUP-335 3D Scroll label issues are fixed.
- SUP-408 Scroll API issues are fixed in Flex.
- AFJ-218 Image fill issues are fixed.
- AFJ-119 RangeBar tooltips are now always correctly positioned.
- AFJ-209 The center anchor works correctly when the scale is modified.
- AFJ-210 Median token calculation is now always correct.
- AFJ-212 Scroll problems in dashboards are now fixed.
- AFJ-219 The Flash tooltip problem in Indicator gauges is fixed.
- AFJ-225 Color Range in Gauge charts is now displayed properly when the scale is
inverted.
- HTML5 engine:
- AFJ-215 The getInformation() method obfuscation problem with Gauge charts is fixed.
- AFJ-123 Axis Crossing attribute problems are fixed.
- AFJ-120 Bar/Line overlay problems are fixed.
- AFJ-145 The underline formatting issue in controls is fixed.
- AFJ-130 Trend Lines tokens autocalculated values issues are fixed.
- AFJ-139 Chart Background Gradient issues are fixed.
- AFJ-142 Labels settings template inheritance issues are fixed.
- AFJ-160 Dashboard layout problems are fixed.
- AFJ-140 The missing points style is now always applied correctly.
- AFJ-161 The funnels resizing problem is fixed.
- AFJ-143 The controls positioning problem is fixed.
- AFJ-119 RangeBar tooltips are now always positioned correctly.
- AFJ-182 Circular ranges in Circular gauges now display gradients correctly.
- AFJ-209 The center anchor works correctly when the scale is modified.
- AFJ-92 The legend is now properly placed when its width is set in percents.
- AFJ-227 The legend no longer overlaps XAxis labels when the chart size is small.
- AFJ-146 Spline series now always shows markers properly.
- AFJ-246 Controls are now always properly positioned in Gauges.
- AFJ-60 Bubble radius calculation is fixed.
- AFJ-237 Pie connectors now properly treat %Color color settings.
- AFJ-238 Text positioning in TreeMap charts is fixed.
- AFJ-241 The logarithmic axis labels display is fixed.
- AFJ-147 Crossing axis titles are fixed.
- AFJ-255 Spline series no longer throws an error when it has only one point.
- SUP-414 Hovering no longer messes backgrounds.
- SUP-413 The tooltip display problem is fixed in Firefox 16.0.2 and Opera 11.62.
- SUP-405 Pie dataplot resize problems are fixed.
AnyChart version 6.0.10 Features Released July 11th, 2012
New features:
- AFJ-182 Circular Gauges Beta in HTML5 engine.
- AFJ-177 Flex component now provides getBase64PNG() and getBase64PDF() methods
with optional width and height parameters.
Bug fixes:
- HTML5 engine:
- SUP-351 Custom attributes are now correctly set via JSON.
- SUP-337 Custom attributes are now correctly retrieved in point events.
- AFJ-204 Action arguments are now correctly passed in JSON.
- SUP-352 maxChar and maxCharFinalChars are now supported.
- SUP-347 Autocalculated datetime scale crash is fixed.
- AFJ-178 Heatmap lower case row/column name problem is fixed.
- SUP-355 First stack elements are no longer hidden when Logarithmic scale is used
with Stacked mode.
- Flash engine:
- SUP-294 Flex "on resize" crash is fixed.
- AFJ-177 getPNG(), getPDF(), saveAsImage(), saveAsPDF() methods now properly handle
optional width and height parameters.
- SUP-328 Marker series is now properly animated.
- SUP-335 Incorrect plot display in 3D mode with scroll enabled is fixed.
- SUP-332 Opacity is now correctly set in 3D "Aqua" pies.
- SUP-355 First stack elements are no longer hidden when Logarithmic scale is used
with Stacked mode.
- SUP-362 Tooltips are properly positioned in Flex with non-absolute
layering used.
AnyChart version 6.0.9 Features Released June 5th, 2012
New features:
- AFJ-36 Blur effect is added in 3D Pie chart in HTML5 engine.
- AFJ-158 Dashed lines support is added to HTML5 engine.
- AFJ-108 Cone shape support is added to Bar series in HTML5 engine.
- AFJ-80 Hatch fills support is added to HTML5 engine.
Bug fixes:
- SUP-306, SUP-294 Flex/Flash: the problem with rendering failure upon the repeated
setting of XML config is solved.
- AFJ-163 HTML5 engine no longer creates functions and variables in the global document
namespace.
- AFJ-132 HTML5 engine: memory leak problem in TreeMaps and AxisBased charts is solved.
- AFJ-157 HTML5 engine: attention IE9 users - only the latest IE9 build is stable enough
to work with AnyChart HTML5 engine.
- AFJ-106, AFJ-109 HTML5 engine: multiple axes markers display problems are solved.
- AFJ-111 HTML5 engine: {%AxisMax} and {%AxisMin} tokens are calculated properly now.
- AFJ-93 HTML5 engine: {%Column} and {%Row} tokens of HeatMap series are calculated
properly now.
- AFJ-133 HTML5 engine: labels rotation problem (over 90°) is solved.
- AFJ-136 HTML5 engine: point border color problem is solved.
- AFJ-153 HTML5 engine: zero line display problem is solved.
- AFJ-159 HTML5 engine: html tags are not displayed and texts look better with
render_as_html option now (HTML support will be available later).
- AFJ-63 HTML5 engine: interactivity settings can now be properly tuned for individual
series and points.
- AFJ-156 HTML5 engine: the problem with Firefox and Chrome rendering failures is solved.
- AFJ-162 HTML5 engine: the problem with the wrong single point Pie charts display is
solved.
- AFJ-83 HTML5 engine: gauge labels display problem is solved.
AnyChart version 6.0.8 Features Released February 28th, 2012
New features:
Bug fixes:
- HTML5 engine: hatch fill is now displayed correctly in Firefox.
- HTML5 engine: selecting points now works correctly in Firefox.
- HTML5 engine now interpolates Candlestick series correctly ("Unimplemented abstract method"
error in Chrome is no longer shown).
- HTML5 engine now parses <data_plot_background> node correctly.
- HTML5 engine blurred gridlines, tickmarks and zero lines - now all these elements are crisp.
- Flex component leaked memory when legend was enabled. This leak is removed.
- Tooltips are now removed correctly on drilldown in Flex component.
- HTML5 engine: dataplot background is now displayed fine in Firefox.
- HTML5 engine: plot position is fixed in Firefox.
- Stacked Area is now displayed correctly even when all elements are negative.
- HTML5 engine now correctly calculates tooltip position in Firefox.
- HTML5 engine now correctly renders radial gradient backgrounds.
- Yet another (new one) printing of Flash in Firefox problem is fixed.
- Flex component failure when deployed to Android or iOS devices is fixed.
AnyChart version 6.0.7 Features Released January 13th, 2012
New features:
- Export as SVG. Using HTML5 version of the component you can obtain snapshot of a chart as
base64 encoded string using new getSVG() external method.
- "Always show zero" scale mode is now supported in HTML5 engine.
- updateData() external method is now supported in HTML5 engine.
Bug fixes:
- Flash and HTML5: Funnel charts were incorrectly displayed when all values are zeros.
- Flash and HTML5: In HeatMap chart type missing values were recognized as zeros.
- HTML5 Engine: Tooltip settings for a certain series were completely ignored by HTML5 engine.
- HTML5 Engine: Existing chart graphics wasn't removed from a canvas after a secondary call of
setXMLFile method.
- HTML5 Engine: Single point Pie charts were displayed incorrectly.
- HTML5 Engine: addPoint() and refresh() external methods worked incorrectly.
AnyChart version 6.0.6 Features Released November 18th, 2011
New features:
- Date time scale is now supported in HTML5 engine.
Bug fixes:
- HTML5 engine: multiplication of chart objects upon sequential set config methods call bug is
fixed.
- Flash engine: incorrect labels placement under certains sizes with scroll bar enabled bug is
fixed.
AnyChart version 6.0.5 Features Released November 14th, 2011
New features:
Bug fixes:
- Radar and Polar problem with Flash Player 11.0.1.152 is fixed.
- Dashboard label, marker and tooltip problems are fixed in HTML5 engine.
- Repetetive config settings crash fixed in HTML5 engine.
- Refresh methods crash is fixed in HTML5 engine.
- Data node in templates is now correctly treated in HTML5 engine.
- Legend with thresholds doesn't crash anymore in HTML5 engine.
- Missing points erraneous console output is fixed in HTML5 engine.
- Pie outside labels work correctly in HTML5 engine.
- FLASH_PREFERED rendering option now works correctly.
AnyChart version 6.0.4 Features Released October 6th, 2011
- New feature: axes markers added to HTML5 engine.
- Bug fix: HTML5 embedding improved.
AnyChart version 6.0.3 Features Released September 28th, 2011
- New feature: dashboards added to HTML5 engine.
- Bug fix: legend placement fix in HTML5 engine.
AnyChart version 6.0.2 Features Released September 20th, 2011
- New feature: Thresholds feature is added to HTML5 engine.
- Bug fix: Resizing issue in Safari for iOS is fixed in Chart Gallery.
- Bug fix: Versioning issue is fixed in Flash engine.
- Bug fix: setData method issue is fixed in Flash engine.
AnyChart version 6.0.1 Features Released September 12th, 2011
- Funnel Chart type is added to HTML5 engine.
- Custom attributes feature is added to HTML5 engine.
AnyChart version 6.0.0 Features Released September 5th, 2011
- HTML5 SVG based engine introduction.
AnyChart version 5.1.3 Features Released June 27th, 2011
- New chart and plot type: Radar. Line,
Area and Marker series supported.
- New chart and plot type: Polar. Scatter
data can be displayed as Line, Area and Marker
series using polar coordinates.
- New: Multiseries pie and donut charts can now use outside labels with connectors.
- New: New external method that allows to animate updated values.
- New: New formatting keywords: maxChar and maxCharFinalChars
that allow to control the number of characters in token.
- Improvement: New parameters in chartMouseMove, pointMouseOut, pointMouseOver events: mouseX and
mouseY.
- Bug fix: Minor missing values interpolation algorithm issue is fixed.
- Bug fix: Flex component "tooltip stick" problem solved.
- Bug fix: Wrong positioning of labels for points with zero value is fixed.
AnyChart version 5.1.2.5 Features Released January 26th, 2011
- New: Chart Show and Hide methods
- Improvement: Pie labeling mechanism improved
- Improvement: JS Scroll interface extended
- Bug fix: JavaScript data manipulation and loosing changes
- Bug fix: "No data" message in Funnel and Treemap
- Bug fix: Memory Leaks in IE
- Bug fix: Point click in Pie charts return value
- Bug fix: Absolute Deviation threshold issues
- Bug fix: Pies and palettes
- Bug fix: Scroll behavior
- Bug fix: Tooltip cut off
- Bug fix: Logarithmic axis labeling
- Bug fix: AM/PM Date Time issue
- Bug fix: Negative values labeling
AnyChart version 5.1.2 Features Released February 13th, 2009

Apex Integration Kit
New Feature - Version 5.1.2 provides an ability to update Oracle Apex with brand new chart engine introduced in
5.1.0
AnyChart version 5.1.1 Features Released February 2nd, 2009
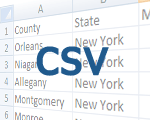
CSV Data Input Support
New Feature - CSV Data Input: use CSV data format to make data file smaller and decrease loading time. Reuse CSV
Tables in different series and dashboard views.
Read
more about CSV Data >>
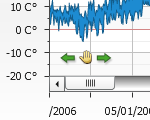
Drag Ability for Scrollable Charts
New Feature - Drag Ability for Scrollable Charts. You can configure chart to make it draggable when the chart
area is zoomed.
AnyChart version 5.1 Features Released January 23th, 2009
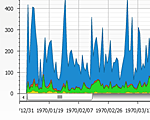
Scrolling Support
New Feature - All X / Y Axes based charts (Bar, Line, Area, Candlestick, OHLC, Combinations, etc.) can have Axes
with scroll bar. Robust, configurable scroll controls with the ability of external JS or Flex control.
View samples of
Scrollable Charts >>
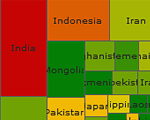
Treemap Charts
New chart type - Treemap Chart allows to displaying tree-structured data using nested rectangles. With Color
coding support,
attribute based thresholds and branches drill down.
View
samples of Treemaps >>
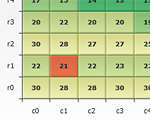
Heatmap Charts
New chart type - Heatmap Charts, allows you to give graphical representation of data where the values taken
by a variable in a two-dimensional map are represented as colors.
View
samples of Heatmaps >>
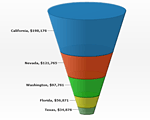
2D/3D Funnel Charts
New chart type added - feature rich Funnel Charts both in 2D and 3D, smart labeling, animation,
neck control and man more option.
View samples of
Funnel Charts >>
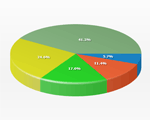
3D Pie Charts
New chart type added - nice looking, interactive 3D Pie Charts with Animation and all features of regular flat
Pie Charts.
View samples
of 3D Pie Charts >>
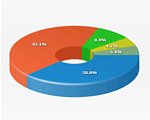
3D Doughnut Charts
New chart type added - nice looking, interactive 3D Doughnut Charts with Animation and all features of regular
flat Doughnut Charts.
View samples
of 3D Doughnut Charts >>
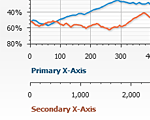
Multiple X-Axis Support
Improvement - Multiple X Axes both for Categorized and Scatter plots are now supported. Any data series can have
its own X Axis now.
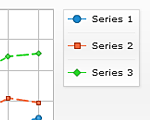
Markers in Legend
New Feature - You can now add marker symbols into series icons to distinguish different series.
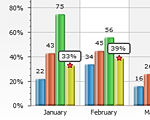
Interactive Labels
Improvement - data point labels made interactive - you can choose what data should be displayed when you hover or
select the data point.
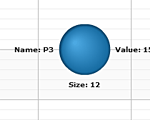
Multiple Data Labels Support
New feature - Multiple Data Labels, you are now not limited with one label per data point - use any number of
them.
You can add any additional information or create several interactive labels that will be shown only when point
is selected.
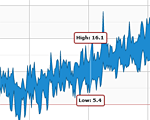
Multiple Data Tooltips Support
New feature - Multiple Data Tootips, you are now not limited with one tooltip per data point - use any number of
them.
This can be set for one point or data series.
Multiple Data Markers Support
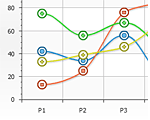
New feature - Multiple Data Markers, you are now not limited with one marker per data point - use any number of
them.
This can be set for one point or data series.
Context Menu Localization
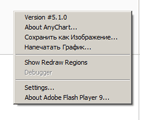
Improvement - AnyChart custom context menu items can have custom text.
This allows you to localize such options as "Save as Image", "Print Chart..", "Save as
PDF...".
Axis Markers Styling Support
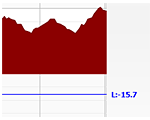
Improvement - Axis Markers Styles are added. Styled axis markers allow to decrease the size of XML settings.

Adobe Air Compatibility
Now AnyChart is fully compatible with Adobe Air ™. Build your RIA or Desktop Application utilizing
the power of AnyChart Flash Charting engine.
Significant Performance Improvements
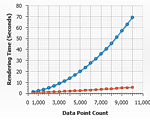
AnyChart 5.1 is based on absolutely new charting engine, which made possible to improve performance and decrease
rendering time and update time dramatically.
New engine allows to used larger data sets without significant time lags, and this applies to all chart types,
including AnyMap extension.
AnyChart 5.0 vs 5.1 Rendering Time
Comparison Chart
On the comparison chart you can see the difference between version 5.0 and 5.1 rendering time. We've measured
the rendering time for 500 to 10.000 points. X Axis shows the number of points and Y Axis shows the rendering
time in seconds.
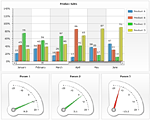
Using Charts, Gauges and Maps in Dashboards
Improvement - all chart types can now be combined within interactive dashboard: all charts, gauges, maps,
funnels. Build
your own interactive dashboard using a wide variety of chart types to attain the right results.
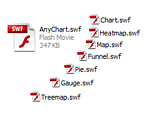
SWF File Size Reduction
The size of AnyChart.swf is decreased. Moreover - special type limited optimized SWF files are introduced. By
default AnyChart provides separate files for rendering All Chart Types, Basic Chart Types, Gauges, Geo Maps,
Tree Maps, Heat Maps, Funnels and several combination SWFs for Dashboarding needs.
AnyChart 5.0Released July 25th, 2008
- Gauges Charting Engine
- Circular (Angular)
- Linear Vertical
- Linear Horizontal
- Image
- Label
- Indicator
- Bullet Graphs
- Exploded Slices for all Pie and Donut Charts.
- Sorting feature for Pie and Donut Charts.
- Dashed Grids and Lines.
- Opera Tooltip Redraw Bug Fixed.
- Map Tooltip Position in Flex Component Bug Fixed.
- Animation in Dashboard Mode.
AnyChart 4.2.1Released January 31st, 2008
- Animation effects, motions, durations, for labels, markers, points and data plot.
- Optimized Chart Performance
AnyChart 4.2.0Released December 29th, 2007
- AnyMap Extension with a number of features (including Charts and Maps in a single
dashboard)
- to many to list in version history
- Interactivity
- Multiple Elements Select
- Selectable/Hoverable Settings for Interactive Elements
- Title, Subtitle and Footer Actions
- updateView and updateChart tokens technique
- Custom Controls with Fixed, Floating and Auto Layout
- Multiple Custom Interactive Labels
- Multiple Legends
- Thresholds
- Custom condition based thresholds
- Automatic Thresholds
- Exporting
- Save As PDF
- Save As Image now has export image size settings
- External invoking of Save As and Printing functions
- Autosaving a chart upon rendering
- Axes
- Axes Custom Labels
- Axes Custom Lines (trends)
- Axes Custom Ranges (zones)
- New Axes Keywords
- New Extra Axes Definition Format
- Templates
- ability to change series and data nodes attributes using template
- No Data Message Configuration
- External showLoading commands and text configuration
- Massive AnyChart.js update
- https issues fix
- wmode parameter support
AnyChart 4.1.1Released November 5th, 2007
- Significant performance improvement
AnyChart 4.1.0Released October 16th, 2007
- Save As Image Feature
- New Chart Types:
- 3D Column (Range, Stacked, 100% Stacked),
- 3D Bar (Range, Stacked, 100% Stacked),
- 2D/3D Pyramid(Stacked, 100% Stacked ),
- 2D/3D Cone (Stacked, 100% Stacked),
- 2D/3D Cylinder(Range, Stacked, 100% Stacked).
- New Financial Chart Types:
- Japanese Candlestick,
- Open-High-Low-Close Chart.
- DateTime:
- X and Y Axes DateTime Scales with full control over labels and scale,
- Fully Customizable DateTime Formatting,
- Flexible DateTime Input/Output localization,
- UNIX TimeStamp Input Format,
- Scatter Charts with DateTime axes.
- Dashboard Creation Feature:
- Create Interactive Dashboard using powerful layout, templates and actions system using only one SWF
file.
- User's Guide Updated:
- Over 80 tutorials with more than 300 chart samples,
- A number of Implementation Samples - including AJAX integration and JavaScript Event Handlers.
- XML Reference Updated.
- Interactivity:
- Unlimited Number of Custom Actions on Point Click - open web page, launch external function, update
another chart in dashboard and drilldown.
- Selected State Configuration for All Chart Types, ability to set default selected element on chart.
- Color Range Palettes - automatic feature for coloring all data points in different colors.
- Preloader Texts Customization Feature
- Advanced Number Formatting and Scaling
- Ability to set Meta Data for Points and Series using Custom Attributes for use in labels, tooltips, legend and
actions.
AnyChart 4.0.6Released September 23rd, 2007
- Complete XML reference with all nodes
- Improved gallery
- Minor bug fixes
- Tokens {%DataPlotYMin} and {%DataPlotYMax} now work in all texts
- Bug fix for with X axis invert for Spline Area series
- x and y attributes of <legend> node were changed to horizontal_padding and vertical_padding
AnyChart 4.0 Official ReleaseReleased September 17th, 2007
- Absolutely New Chart Engine for Flash Player 9
- New XML Format
- Over 60 Chart Types
- Aqua Look for Bar, Column and Bubble Charts Style
- Effects, Styles, Templates
- Rich Interactivity Options
- ... and many more new features.
AnyChart 3.1 Official ReleaseReleased April 2nd, 2006
AnyChart 3.0Released October 15th, 2005
- Chart engine updated
- New chart types: Dot chart, Range 3D Column, Range Column, Stacked 3D Column, Horizontal Range Column,
Horizontal Range 3D Column chart,
Stacked Horizontal Column, Stacked Horizontal 3D Column, Combination Column and Line chart
AnyChart 2.3Released December 1st, 2004
- Horizontal Column chart
- New chart types: Horizontal 3D Column, Doughnut, 3D Pie chart, Stacked Column, Scatter Line chart with missing
values support
- Multilanguage support
- Improved Background: image fill
AnyChart 2.2Released October 21st, 2004
- New Line chart: Scale inverts
AnyChart 2.0Released October 14th, 2004
- New chart types: Column, 3D Column, Pie,Candlestick
- Objects: Image, Line, Area, Sound, Text, Trend, Legend
|
