Chart Layout
Overview
This section describes the options and settings for chart layout, alignment and dimensions.

Outside Margins
Outside margins define the space between the plotting area and the border od the Flash movie. These margins are set in pixels;
they remain permanent until explicitly changed.
The space defined by the outside margins is colored in Flash movie background settings, defined using JavaScript API or HTML embed code.
Here is a sample XML for defining outside margins:
01 |
<?xml version="1.0" encoding="UTF-8"?> |
02 |
<stock xmlns="http://anychart.com/products/stock/schemas/1.9.0/schema.xsd"> |
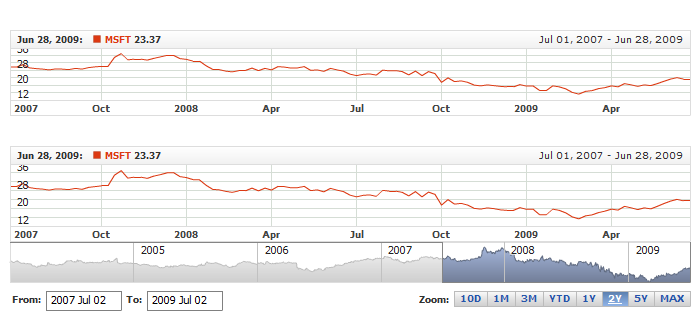
The live sample below shows a chart with all outside margins set to 50 pixels. To make
the margins visible, the background is made pink, and all the white space around it shows
the outside margins. Also note the value axis labels - they are placed on the uncolored place, to avoid such
situations please use inside margins.
Live Sample: Layout - Using Outside Margins
Inside Margins
Inside margins define the space required for elements around a chart, such as Custom Labels or Axes Labels.
Here is a sample XML for defining inside margins:
01 |
<?xml version="1.0" encoding="UTF-8"?> |
02 |
<stock xmlns="http://anychart.com/products/stock/schemas/1.9.0/schema.xsd"> |
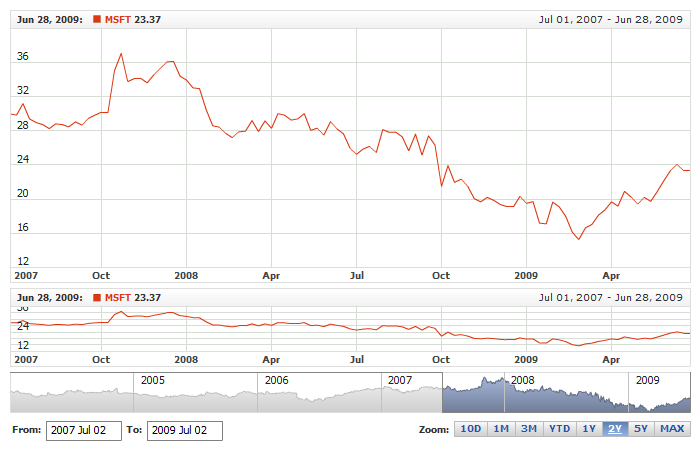
This live sample shows that the chart background takes almost
the entire space of the movie, while the chart itself is squeezed. Note the value axis labels - they are now placed on the colored background:
Live Sample: Layout - Using Inside Margins
Paddings
For each chart you can set top and bottom paddings. These paddings can be useful when you define custom labels.
Here is a sample XML for setting paddings:
The live sample below demonstrates the settings given above:
Live Sample: Layout - Chart Paddings
Chart Height
AnyChart Stock is capable of showing several charts with the same argument one above
the other. By default, if several charts are shown - they all have the same height, but you can
change this.
You can't set the height for each chart explicitly, for all the charts
occupy the space dynamically, with reference to margins, paddings and scroller height.
The height of each chart is defined by the height attribute of <chart> node;
for example, <chart height="5">, where height is weight
number of its height related to another charts. The ratio between the charts' heights remains
unchanged no matter how the size of the embedded movie varies.
Here is a sample XML for defining chart heights:
The live sample below shows two charts: the first one has the height
property set to 100, and the second one - to 30; as the result, the second chart
takes less space:
Live Sample: Layout - Chart Height