Y-Axis Markers
Overview
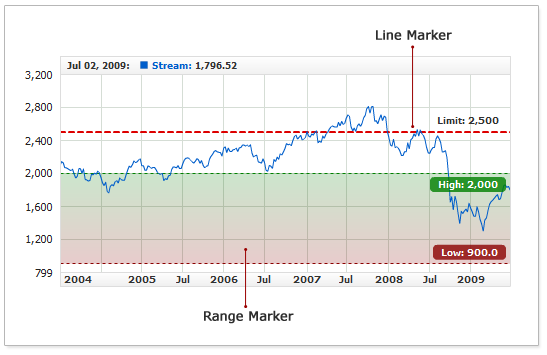
AnyChart Stock supports "Axis Markers", which allow showing trends, limits, and other important information.
The current version supports two types of markers:
- Line Marker - a horizontal line bound to some value on the Y-axis.
- Range Marker - is bound to two values on the Y-axis and allows defining a line for each value and a custom filler between those lines.
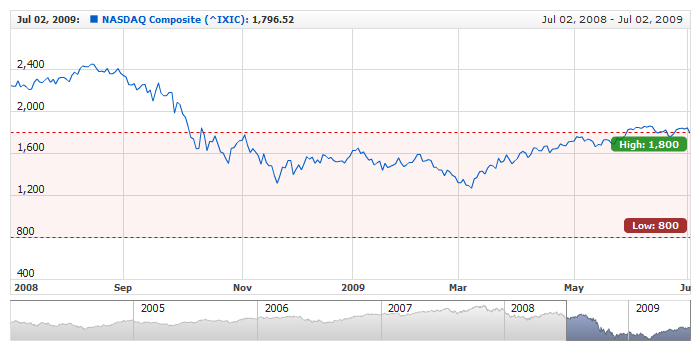
Any marker can have several labels positioned by the Y-axis marker. The illustration below demonstrates the both marker types:
Axis Markers are bound to the Y-axis and can be used with both primary and extra Y-axes; you can add any number of the markers to a chart.
Here is a sample XML that shows where the marker configuration parameters are to be placed:
01 |
<?xml version="1.0" encoding="UTF-8"?> |
02 |
<stock xmlns="http://anychart.com/products/stock/schemas/1.9.0/schema.xsd"> |
As you can see in the sample, Line markers are defined in the <line_markers> node, and Range Markers - in the <range_markers> node. You can also see that they both can be bound to the primary and extra Y-axes.

Line Markers
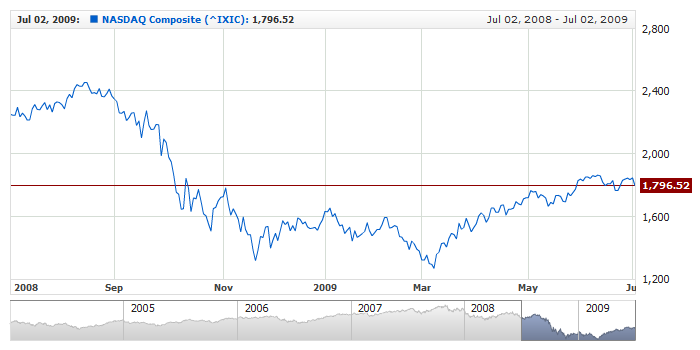
A line marker displays one value on the Y-axis in the form of a line and/or a set of labels.
Adding Line Markers
When creating a line marker, you should specify one exact value on the axis it is bound to. The number of markers is not limited, and they all are defined with a list of the <line_marker> nodes.
This sample XML demonstrates the definition of three line markers on the primary Y-axis:
01 |
<?xml version="1.0" encoding="UTF-8"?> |
02 |
<stock xmlns="http://anychart.com/products/stock/schemas/1.9.0/schema.xsd"> |
The value attribute sets the value on the Y-axis the marker is bound to.
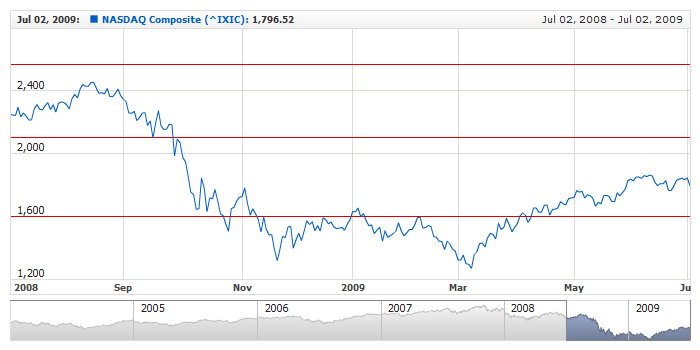
The live sample below demonstrates the three line markers in action:
Live Sample: Y-Axis Markers - Line Marker
These lines use the default settings, so they look similar; however, you can customize them. The customization is going to be described right next.
Line Settings
A line marker can be drawn as solid or dashed line. The sample XML below demonstrates the configuration of them both:
01 |
<?xml version="1.0" encoding="UTF-8"?> |
02 |
<stock xmlns="http://anychart.com/products/stock/schemas/1.9.0/schema.xsd"> |
As you can see in the sample, the line is configured in the <line> subnode. To make the line dashed, you are to set the dashed attribute to 'true' and (optionally) define the dash_length and dash_space.
The live sample below demonstrates the above configuration in action:
Live Sample: Y-Axis Markers - Line Settings
Learn more about line settings for line markers in XML Reference.
Labels
An axis marker can have an unlimited number of labels - depending on your task, you can add one, two, three or more labels placed in different areas, with different text and appearance.
Labels are defined by the set of the <label> nodes. For example:
Below follows the description of label configuration.
Positioning
A label can be placed on any position relative to the marker line inside the data plotting area. Be default, labels are placed above the marker line to the right of the plotting area.
The following attributes of the <label> node are used for defining label position:
| Attribute |
Possible Values |
Description |
| anchor |
Left
Center
Right
|
Sets label anchor. |
| valign |
Top
Center
Bottom |
Sets label vertical alignment. |
| halign |
Left
Center
Right |
Sets label horizontal alignment. |
| x_padding |
Any number |
Sets label X padding. |
| y_padding |
Any number |
Sets label Y padding. |
Here is a sample XML that demonstrates defining a label position:
Text and Tokens
To define a label text, use the <format> node, you can use either a static text or a {%Value} token, which would be replaced with the actual value set in the value attribute of <line_marker> node.
Here is a sample XML that shows how to define a label text:
With this formatting, the label would display the following text: "Value: 1800.00". The {%Value} token can be formatted just as any other token - see Number Formatting for more information.
Font
Label font is configured in the typical <font> node.
There are two major options for configuring label font:
- Apply same font for entire text with the <font> node .
- Use HTML formatting. To do this, you are to include the <font render_as_html="true"/> line in the configuration.
This XML sample demonstrates how to define font settings with the <font> node:
Another example - doing the same with the HTML tag:
05 |
<format><![CDATA[[Value: <b><font color="#883333">{%Value}</font></b>]]></format> |
08 | format: "[Value: <b><font color=\"#883333\">{%Value}</font></b>" |
Find out more about font settings and HTML formatting in Font Configuration.
Background
You can enable background to make the text in a label easier to read. Background is configured in the <background> node.
The sample XML below demonstrates how to define label background:
10 | format: "Upper Limit: {%Value}", |
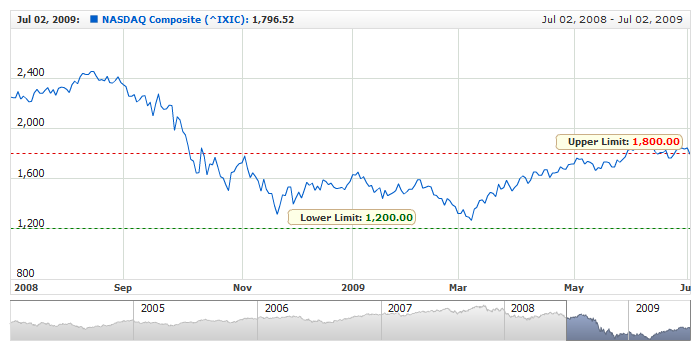
Sample with All Settings
Take a look at the sample below that uses all the settings described above, including HTML text formatting:
Live Sample: Y-Axis Markers - Line Marker with Label
Range Markers
A range marker is bound to two Y-axis values: high and low. It appears as two lines and a filler between them. Just as line marker, range marker can have an unlimited number of labels, but these labels have more anchors.
Adding Range Markers
When adding a range marker, you should define the limits that you want to show on the plot. The number of markers is not limited, and they all are defined in the list of the <range_marker> nodes .
This sample XML demonstrates adding three range markers to the primary axis:
01 |
<?xml version="1.0" encoding="UTF-8"?> |
02 |
<stock xmlns="http://anychart.com/products/stock/schemas/1.9.0/schema.xsd"> |
As you can see here, the limits of the range are
set by the low_value and high_value
attributes.
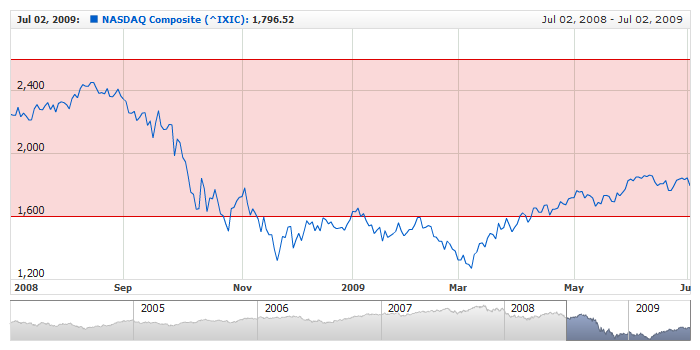
Here is a live sample for a range marker between 1600 and 2600:
Live Sample: Y-Axis Markers - Range Marker
This is what a range marker looks like by default; you can tune up the visual settings to customize its appearance. The customization is going to be covered right next.
Visual Settings
A range marker consists of three elements:
- Lower range limit line
- Upper range limit line
- Range filler
The sample XML below demonstrates the configuration of them both:
The lines can be either solid or dashed; the filler can be solid or gradient. The sample XML below demonstrates how to configure the appearance of a range marker:
The live sample demonstrates two range markers with different visual settings. The first range has a solid filler, while the second one - gradient:
Live Sample: Y-Axis Markers - Range Visual Settings
Find out more about fill configuration in Background Tutorial and XML Reference.
Labels
An axis marker can have an unlimited number of labels - depending on your task, you can add one, two, three or more labels placed in different areas, with different text and appearance.
Labels are defined by the set of the <label> nodes. For example:
Below follows the description of label customization.
Positioning
A label can be placed on any position relative to the marker line inside the data plotting area. Be default, labels are placed above the marker line to the right of the plotting area.
The following attributes of the <label> node are used for defining label position:
| Attribute |
Possible Values |
Description |
| anchor |
LeftTop
RightTop
LeftBottom
RightBottom
LeftCenter
RightCenter
TopCenter
BottomCenter
Center
|
Sets label anchor. |
| valign |
Top
Center
Bottom |
Sets label vertical alignment. |
| halign |
Left
Center
Right |
Sets label horizontal alignment. |
| x_padding |
Any number |
Sets label X padding. |
| y_padding |
Any number |
Sets label Y padding. |
Here is a sample XML that demonstrates defining a label position:
With such settings label is placed in the top right
corner of the area.
Text and Tokens
To define a label text, use the <format> node, you can use either a static text or the {%LowValue} and {%HighValue} tokens, which would be replaced with the actual value set in the low_value and high_value attributes of the <range_marker> node.
Here is a sample XML that shows how to define a label text:
04 |
<format><![CDATA[Range: {%LowValue} - {%HighValue}]]></format> |
06 | format: "Range: {%LowValue} - {%HighValue}" |
With this formatting, the label would display the following text: "Range: 1800.00 - 2600.00". The {%LowValue} and {%HighValue} tokens can be formatted just as any other token - see Number Formatting for more information.
Font
Label font is configured in the typical <font> node.
There are two major options for configuring label font:
- Apply same font for entire text with the <font> node .
- Use HTML formatting. To do this, you are to include the <font render_as_html="true"/> line in the configuration.
This XML sample demonstrates defining font settings with the <font> node:
Another example - doing the same with the HTML tag:
05 |
<format><![CDATA[Range: <b><font color="#883333">{%LowValue} - {%HighValue}</font></b>]]></format> |
09 | format: "Range: <b><font color=\"#883333\">{%LowValue} - {%HighValue}</font></b>" |
Find out more about font settings and HTML formatting in Font Configuration.
Background
You can enable background to make the text in a label easier to read. Background is configured in the <background> node.
The sample XML below demonstrates how to define label background:
04 |
<format><![CDATA[Range: {%LowValue} - {%HighValue}]]></format> |
11 | format: "Range: {%LowValue} - {%HighValue}", |
Sample with All Settings
Take a look at the sample below that uses all the settings described above, including HTML text formatting:
Live Sample: Y-Axis Markers - Range Marker with Labels
Force Markers to Affect Scale Range
By default, markers bound to an axis do not affect the scale minimum and maximum. If the scale changes because of zooming or scrolling, and the values get out of the range - they would not be shown.
If you need to show the range and its labels no matter what happens with the data, you need to use the special option that includes range limits in the auto-calculation of the scale.
That is the affects_scale_range attribute, which should be set to true to include marker value (or limits) in the scale auto-calculations. Here is a sample XML that demonstrates including two markers into the calculation:
The live sample below demonstrates the axis markers always shown on the chart:
Live Sample: Y-Axis Markers - Force Markers to Affect Scale Range
Binding to series values
Axis marker can contain not only some static text, but some live data from the series, for example: display the last closing price on the axis.
Sample XML/JSON snippet with line axis marker bound to Close value of Line series:
As you can see, to use binding you have to set value_mode to Bound, set id of series in series_id attribute and set value_token to which this marker is bound.
value_token defines to which value axis marker is bound, tokens that can be used here are the same ones you use in legend or tooltips. You can read about tokens at: Legend Series Labels: Tokens.
You can use custom fields from data provider and the following standard tokens: {%Open}, {%High}, {%Low}, {%Close}, {%Volume} and {%Value}.
For these tokens you can use {*.First}, {*.Last}, {*.FirstVisible}, {*.LastVisible}, {*.Min}, {*.Max}, {*.MinVisible} and {*.MaxVisible} properties.
Live sample below shows line axis marker bound to the last visible value of Line series - it uses {%Value} token, scroll through the chart to see how marker follows the value:
Live Sample: Y-Axis Markers - Binding to Line Series
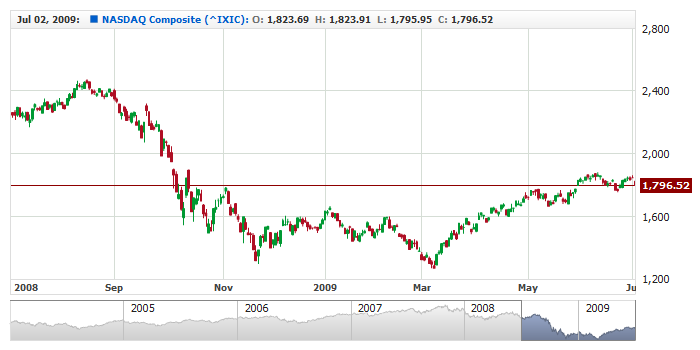
Another live sample shows marker bound to last visible value, but it uses {%Close} token:
Live Sample: Y-Axis Markers - Binding to Candlestick Series
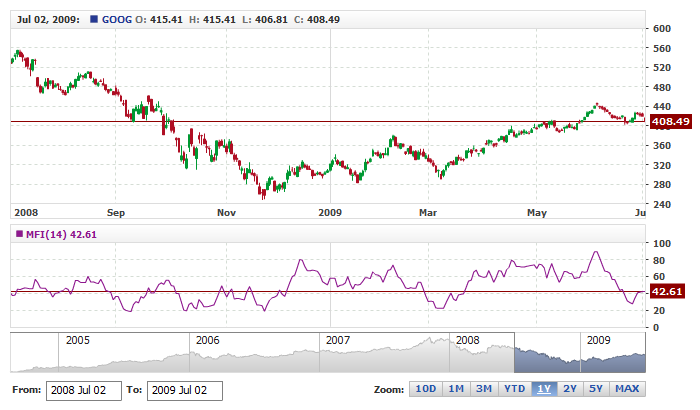
And a sample with line axis markers bound to Money Flow Index(MFI) technical indicator series:
Live Sample: Y-Axis Markers - Binding to Technical Indicator
Default Settings
If you use a lot of line or range markers with identical visual or label settings, it is better to use default settings to avoid settings duplication.
You can set default settings for all axis markers of Y axis in:
- <line_marker_defaults> - for line markers,
- <range_marker_defaults> - for range markers.
Sample XML below shows how to set defaults for all markers:
65 | format: "{%LowValue} - {%HighValue}", |
Live sample below shows how defaults for axis markers can be set and how certain marker settings can be reset:
Live Sample: Y-Axis Markers - Using Defaults