Numbers Formatting
Overview
In AnyChart stock if you have a keyword token that returns a numerical value you can format it using formatting postfixes. In the article below all parameters are listed with the usage explanation and sample syntax.
Formatting
All formatting parameters for keyword are specified in a following way: {%KeywordName}{Param:value} or, if you need to specify several parameters: {%KeywordName}{Param1:Value1,Param2:Value2}, note that all keywords, parameters and parameter values are case-sensitive.
If you want to use these symbols ":", "{", "}" , "," in parameter format use "\:", "\{", "\}" , "\," instead.
By default all number keywords are formatted, to disable formatting use {%KeywordName}{enabled:false}
Decimal Separator Sign
The decimal separator is a symbol used to mark the boundary between the integer and the fractional parts of a decimal numeral. You can change the decimal separator to the symbol common in your country or industry using decimalSeparator parameter. The default decimal separator in AnyChart Stock is dot: "."
Sample changing decimal separator to comma: ","
04 |
<format><![CDATA[{%Value}{decimalSeparator:\,}]]></format> |
05 | format: "{%Value}{decimalSeparator:\,}" |
Live sample below shows different variants of decimal sign use for the one value in series tooltip:
Live Sample: Number Formatting - Decimal Separator Sign

Number of Decimal Digits
The number of digits to be shown after the decimal separator is controlled using numDecimals parameter, all digits are simple truncated - not rounded.
Sample changing the number of decimal digits to 3.
05 | format: "{%Value}{numDecimals:3}" |
Live sample below shows different settings for decimal digits in series tooltip:
Live Sample: Number Formatting - Number of Decimals
Thousands Separator
Numbers with many digits before the decimal separator may be divided into groups of three,
starting from the decimal separator to the left. The symbol for this is called the thousands separator or digit group separator. If the decimal separator is a point, the thousands separator is often a comma or a space. To change the thousands separator use thousandsSeparator parameter.
Sample changing the thousands separator to space: " ".
04 |
<format><![CDATA[{%Value}{thousandsSeparator: }]]></format> |
05 | format: "{%Value}{thousandsSeparator: }" |
Live sample below shows different thousand separator settings in series tooltip:
Live Sample: Number Formatting - Thousands Separator
Plus Sign for Positive Values
You can show positive number with "+" sign before the digits, this format is common for charts in comparison mode.
To do that use: plusSign:true parameter:
05 | format: "{%Value}{plusSign:true}" |
Live sample below shows different elements formatted with plus sign:
Live Sample: Number Formatting - Plus Sign
Negative Sign Display
Negative values can be displayed several different ways, and you can set how they are to appear. The negativeSignStyle parameter is an enum, which defines the format of the negative values to be shown. Here is the list of the available options:
| Value |
Description |
Value |
Display |
| None |
The negative sign is dropped. |
-23 |
23 |
| Left |
The minus sign is placed to the left of the number. Default. |
-23 |
-23 |
| LeftIndent |
The minus sign is placed to the left of the number, separated from the number with a space. |
-23 |
- 23 |
| Right |
The minus sign is placed to the right of the number. |
-23 |
23- |
| RightIndent |
The minus sign is placed to the right of the number, separated from the number with a space. |
-23 |
23 - |
| Brackets |
Negative values are shown in brackets. |
-23 |
(23) |
The sample XML below shows how to make negative values appear in brackets instead of the minus sign:
04 |
<format><![CDATA[{%Value}{negativeSignStyle:Brackets}]]></format> |
05 | format: "{%Value}{negativeSignStyle:Brackets}" |
Live sample shows all possible options for negative values display in series tooltip:
Live Sample: Number Formatting - Negative Sign Style
Number of Leading Zeros
A leading zero is any zero that leads a number string with a non-zero value.
Leading zeros are
also likely to be used by utility billing systems, human
resources information systems and government databases.
Leading zeros are used to make ascending order of numbers
correspond with alphabetical order: e.g. 11 comes
alphabetically before 2, but after 02.
The number of leading zeros can be controlled using leadingZeros parameter. The sample below demonstrates setting the number of leading zeros to 5:
05 | format: "{%Value}{leadingZeros:5}" |
Live sample below shows one value formatted with a different number of leading zeros in series tooltip:
Live Sample: Number Formatting - Leading Zeros
Trailing Zeros
In mathematics, trailing zeros are the sequence of zeros in the decimal representation
(or more generally, in any positional representation) of a number, after which no other digits follow.
Trailing zeros to the right of the decimal point, as in 12.3400, do not affect the value of the number
and may be omitted if all that is of interest is its numerical value. This is true even if the zeros
recur infinitely. However, trailing zeros may be useful for indicating the number of significant figures,
for example in measurement. In such context, "simplifying" the number by removing trailing zeros wouldn't be incorrect.
The special formatting option for showing trailing zeros is trailingZeros, which is boolean;
it can be either true or false. By default it is true, and if you want to disable showing trailing zeros, you would have to set it to false explicitly:
04 |
<format><![CDATA[{%Value}{numDecimals:5,trailingZeros:false}]]></format> |
05 | format: "{%Value}{numDecimals:5,trailingZeros:false}" |
Note: trailingZeros:true makes sense and works in conjunction with the numDecimals parameter.
If the format is set to {%Value}{numDecimals:5,trailingZeros:false} then:
- if {%Value} returns "500" - it is shown as "500"
- if {%Value} returns "1.25" - it is shown as "1.25"
But if the format is set to {%Value}{numDecimals:5,trailingZeros:true} then:
- if {%Value} returns "500" - it is shown as "500.00000"
- if {%Value} returns "1.25" - it is shown as "1.25000"
Live sample below shows how trailingZeros work with numDecimals in series tooltip:
Live Sample: Number Formatting - TrailingZeros
Values Scaling
In certain application areas it is very useful to scale values according to some custom user-defined scale. The examples of this can be found almost everywhere: kilobyte has 1024 bytes in it, minute consists of 60 seconds, yard - 3 feet, troy ounce - 480 grains.
AnyChart allows you to set a custom scale for any value using scale parameter.
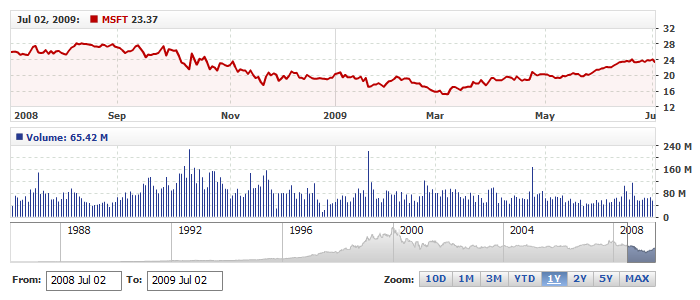
Sample setting the number scaling according to the common short names of thousands (k), millions (m) and billions (b):
04 |
<format><![CDATA[{%Value}{scale:(1000)(1000)(1000)|( K)( M)( B)}]]></format> |
05 | format: "{%Value}{scale:(1000)(1000)(1000)|( K)( M)( B)}" |
The result of such scaling will be as shown in the table below:
| Input |
Scaled |
| 1000 |
1 K |
| 10000 |
10 K |
| 1000000 |
1 M |
| 1000000000 |
1 B |
Live sample 1:
Live Sample: Number Formatting - Values Scaling for Volume Labels
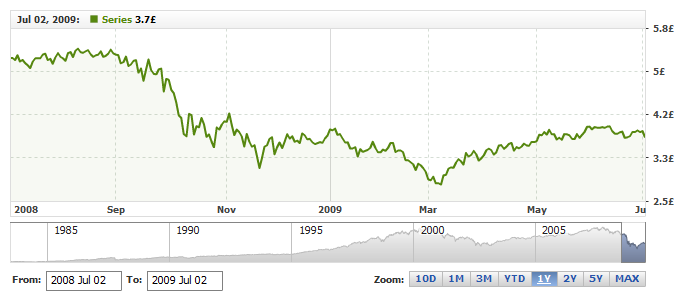
Another example of scaling: 1 pound consists of 20 shillings, 1 shilling - 12 pence. So we have the following scale:
04 |
<format><![CDATA[{%Value}{scale:(1)(12)(20)|(p)(s)(£)}]]></format> |
05 | format: "{%Value}{scale:(1)(12)(20)|(p)(s)(£)}" |
Live sample 2:
Live Sample: Number Formatting - Values Scaling Pound Units
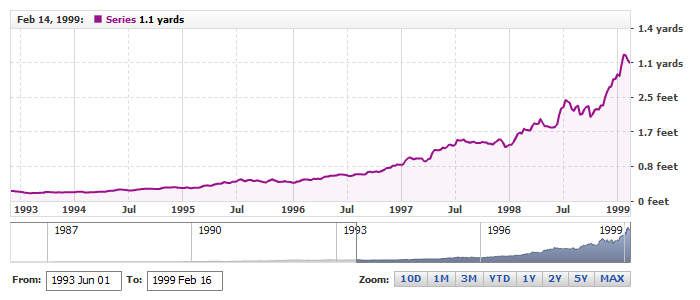
And the sample for length/distance units:
1 feet = 12 inches
1 yard = 3 feet
1 mile=1760 yards
04 |
<format><![CDATA[{%Value}{scale:(12)(3)(1760)|(feet)(yards)(miles)}]]></format> |
05 | format: "{%Value}{scale:(12)(3)(1760)|(feet)(yards)(miles)}" |
Live sample 3:
Live Sample: Number Formatting - Values Scaling Length Units
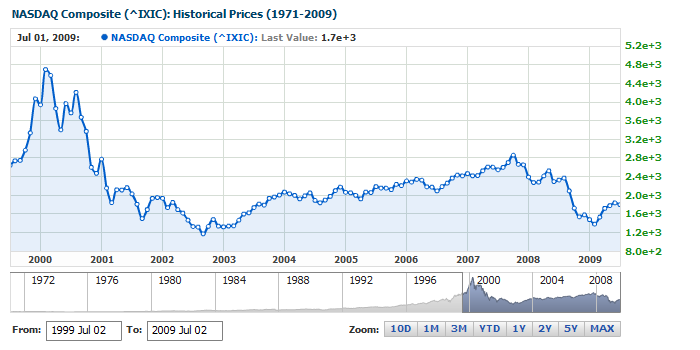
Exponential (Scientific) Notation
If you want to display numbers in an exponential notation (also known as Scientific) like: 1e+10, which denotes
"times ten raised to the power of" or, as it usually written in mathematics: "x 10b", please
use scientificMode parameter, which can be true or false:
04 |
<format><![CDATA[{%Value}{scientificMode:true}]]></format> |
05 | format: "{%Value}{scientificMode:true}" |
Note: only numDecimals and decimalSeparator options are respected when
scientific mode is enabled, all other options are ignored.
Here is a sample of a chart where all numbers are displayed in scientific format with one decimal digit:
Live Sample: Number Formatting - Scientific mode
Default Number Formatting
If you want to use the same format for all numbers in all charts and elements - you can use global formatting settings.
To do so you should use <format> node in <display_locale>. You have to specify the parameters in <format> just like you do that for tokens.
Sample XML settings are:
03 |
<format><![CDATA[numDecimals:3,negativeSignStyle:Brackets,plusSign:true]]></format> |
03 | format: "numDecimals:3,negativeSignStyle:Brackets,plusSign:true" |
Note: If you use any formatting in place, for example, set format as "{%Value}{numDecimals:1}" - then default format
is merged with set format.
Live sample below shows global number format settings:
Live Sample: Number Formatting - Default format