Your First Chart
Overview
AnyChart Stock - Financial Flash Charts is a flexible component for creating stock and financial charts for the Web. You can easily create a
lot of charts using it, so let's take a step-by-step tour and learn how to create a page with a chart on it.

Files and Folders
To add a financial chart to your web page, you will need the following simple things:
- AnyChartStock.swf and Preloader.swf files.
- JavaScript library for adding chart to HTML page.
- XML or JSON file with settings.
- CSV file with data.
So, let's start. Here is the recommended structure for the project folders:
Let's fill it with the files we need. Once you have downloaded and installed (or unpacked) the component (Download AnyChart Stock - Financial Flash Charts Component),
open the AnyChartStock folder. It contains the following sub folders that we need:
- AnyChartStock installation folder
SWF files
The swf folder contains two SWF files:
- AnyChartStock.swf - main file used for rendering charts.
- Preloader.swf - auxiliary file used for showing the download progress for the main AnyChartStock.swf file.
Now copy both files to our /anystock-basic-sample/swf folder.
JavaScript Library
Now locate the /js sub folder in the AnyChart Stock installation folder.
It contains only one file - AnyChartStock.js.
Copy it to /anystock-basic-sample/js
Register
If you want to run a sample on your local PC and not on the web, you need to allow the Flash Player to access the local files.
To make this registration process easier, we have created two files: register.bat for Windows and register.sh for the *nix systems.
You can find them in the AnyChartStock installation folder.
Copy the required file to the /anystock-basic-sample folder.
Now, as you have copied all the prerequisites to the required folders, the folder and file structure should look like this:
- anystock-basic-sample
- swf
- AnyChartStock.swf
- Preloader.swf
- js
- csv
- register.bat (or register.sh), if needed
Embedding
The next step is adding the chart to a page.
We will create an HTML document named index.html in the
/anystock-basic-sample folder with the following html content:
This JavaScript code adds the chart to the page.
Note: Because of Flash security settings, this (and all Flash-based visualizations) might not work correctly when accessed locally (e.g., file:///c:/webfolder/anystock-basic-sample/index.html) rather than remotely, via a web server URL (e.g., http://www.myhost.com/anystock-basic-sample/index.html).
To override this issue - please close your browser and run register.bat (or register.sh) before launching the sample.
Now launch index.html, and you should see a picture like that:
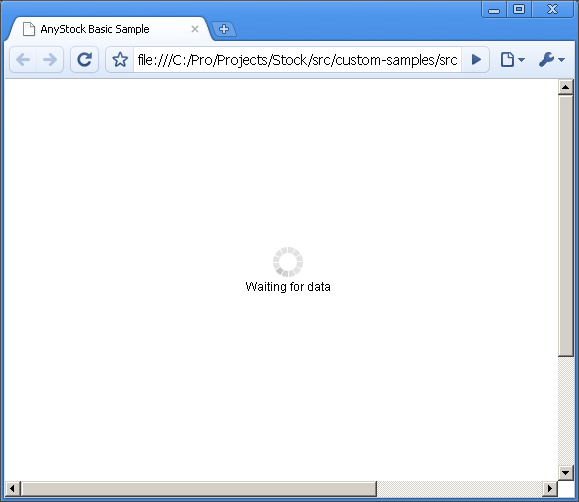
On the next step, we are going to customize the chart and add data to be displayed.
Note: AnyChart Stock provides a lot of options for chart embedding, please refer to: JavaScript Embedding article to learn more.
Preparing Data File
For data source, the AnyChart Stock Component uses CSV-formatted data. The source can be either an external CSV file or a part of the XML settings file. In XML settings, you define what columns of the CSV table are to be used, and how they are to be used.
To display the most simple chart, the component needs a CSV data table with at least two rows.
One of its columns should contain DateTime values, because the component can use only
DateTime values as chart arguments. The other column or columns
are used as values.
Below you can see a sample table; it is created and saved as CSV with a spreadsheet editor:
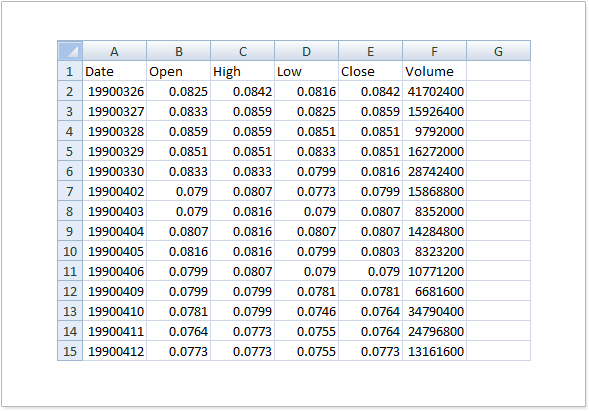
As you can see here, the table has six columns, and the first one contains date in the yyyyMMdd format - year, month and day, with
leading zeros for months and days, without any separators. Other columns: Open, High, Low, Close and Volume - are
value columns and can be shown on the chart in different ways.
For our sample, we will take a sample CSV file with historical data for Microsoft (MSFT) daily trading data from 1986 through 2009,
where each row stands for one trading day.
You can take a look at this file here: msft_daily.csv
Defining Chart
Defining data source and customizing chart settings can be done in the XML file with special XML tags or JSON file with JSON structure, or using the same formats as strings. Learn more about possible ways to set config data in XML/JSON Configuration Options article
In this sample we use XML file with config set in XML format.
When the page
loads, the SWF file loads the XML file with the settings and processes it. You can browse through all the possible
nodes and attributes in AnyChart Stock XML in XML Reference.
In the following section, we will create a sample XML and see what XML settings are used here.
Data Sets
As it has been said already, AnyChart Stock uses CSV formatted data as data source.
In this sample, we are going to use an external CSV formatted file (msft_daily.csv, mentioned above).
We need to specify explicitly how the CSV data is formatted, which column contains the DateTime argument, and
how it is formatted. Settings of this type are made with the so-called Data Sets.
XML syntax for Data Set declaration and settings looks like this:
01 |
<?xml version="1.0" encoding="UTF-8"?> |
02 |
<stock xmlns="http://anychart.com/products/stock/schemas/1.9.0/schema.xsd"> |
As you can see on the XML listing, the Data Set is declared with the <data_set> node, where the following attributes are set:
| Attributes |
Description |
| id |
Unique Data Set identifier, which is further used by Data Providers. The id in this sample is "dataSetMSFT". |
| source_mode |
Sets whether CSV data is built in XML or given in an external file. In our sample, we use the external file option, so the value of this attribute is "ExternalData". |
| source_url |
Sets path to the file (or server side script) that provides data in the CSV format. We use a static CSV file, so the value of this attribute is "./csv/msft_daily.csv". |
| date_time_column |
Sets zero-based index of the column with the DateTime argument. In msft_daily.csv, the column is the first one, so the value is set to "0". |
It is also important to describe the format of CSV data. In msft_daily.csv, the first row contains column
headers; each row ends with a "\n", and each column ends with "," - all the data must
be set in XML, in order for the component to be able to parse the data. The CSV format details are set in the <csv_settings> node.
See the syntax for such settings:
As you can see here, there are three attributes set in <csv_settings>:
| Attributes |
Description |
| ignore_first_row |
Defines whether there is any data in the first row or it contains headers.
It can be "true" or "false". In msft_daily.csv, the first row contains
column names, so we set this attribute to "true". |
| rows_separator |
Sets character for separating rows. In our sample that's "\n" (End of Line),
so we set the attribute value to "\n". |
| columns_separator |
Sets column separator character. In our samples that's coma,
so we set the attribute value to ",". |
Now we need to define the DateTime format for the argument. In our sample we have the values that look like: 19860313, 19860314, 19860317, and so on. That's four characters for year, two - for month, and the last two - for day. In the XML, the DateTime format is set as follows:
As you can see here, the DateTime format is set in the <format> node. In this sample, we have it as "%yyyy%MM%dd", where:
%yyyy - token for a four-digit year value.
%MM - token for a two-digit month value with a leading zero when required.
%dd - token for a two-digit day value with a leading zero when required.
The AnyChart Stock Component supports a lot of tokens, so you can take advantage of almost any DateTime format.
The complete list of the tokens can be found in Input Data Settings article, which also contains all information you need to know about input data configuration.
Note: AnyChart Stock provides a lot of options for data input and configuration, please refer to: Understanding Data Model and Data Sets Configuration articles to learn more about data sets.
Data Provider
When a Data Set is ready and set as needed, we need to create Data Providers for the series and the scroller.
Series Data Provider
Data Provider is used to define which columns from Data Set are to be used by series to display the chart or
for calculating and plotting the technical indicator.
In our sample, we will show only one series of the Line type. This series requires only one value.
The XML syntax for Data Provider looks like this:
01 |
<?xml version="1.0" encoding="UTF-8"?> |
02 |
<stock xmlns="http://anychart.com/products/stock/schemas/1.9.0/schema.xsd"> |
As you can see here, Data Provider is defined in the <data_provider> node with the following attributes:
| Attributes |
Description |
| data_set |
Sets name for Data Set with data. This attribute is mandatory. We have Data Set with id="dataSetMSFT", so we set the data_set attribute to "dataSetMSFT". |
| id |
Unique identifier of Data Provider. This attribute is mandatory and is used by series. |
Now we need to define the fields to be used by the series. The column selection is set in the
<field> node. The XML syntax for fields looks like this:
As you can see, <field> node has the following required attributes:
| Attributes |
Description |
| type |
Sets the type of the column.
The type may vary, but we will use "Close", because this is Close value and it is one of types that may be used with "Line". |
| column |
Zero-based index of the column, which the field is bound to. In our sample, we use the fifth column, so the attribute is set to "4". |
Note: AnyChart Stock provides a lot of options for data providers, please refer to: Understanding Data Model and Data Provider Configuration articles to learn more about data providers.
Scroller Data Provider
Scroller is used to navigate through the chart - zoom and scroll to the ranges of interest. To provide the user with the idea where the range of interest can be Scroller can display a small chart in its background.
In order to display this chart Scroller should know where this data is located - it needs Data Provider.
Scroller Data provider should be defined, note that it uses the same data set and same field as general data provider:
01 |
<?xml version="1.0" encoding="UTF-8"?> |
02 |
<stock xmlns="http://anychart.com/products/stock/schemas/1.9.0/schema.xsd"> |
And when it is defined - applied:
Note: we don't describe Scroller options in full, please refer to Scroller Overview and Scroller Data Provider articles to learn more.
Series
When Data Set and Data Provider are ready, we can start customizing the chart and defining series.
Now we are going to add one series of the Line type. The source for the series is ready,
so all we have to do now is to add it to the chart. Here is what series definition XML should look like:
The <series> node has the following attributes:
| Attributes |
Description |
| type |
Series type. The AnyChart Stock Component supports several chart types. In this sample, we use the "Line" type. |
| data_provider |
Sets Data Provider to be used. This mandatory attribute should link to an existing Data Provider. In our sample, we have only one Data Provider named "dpMSFT". |
| color |
Sets the series color. When the color isn't set - the series is drawn in Black. |
| Subnodes |
Description |
| <name> |
This subnode contains series name. This name is used in the legend. This is a mandatory parameter. |
Note: AnyChart Stock provides a lot of options for series, please refer to: Understanding Data Model and Creating Series articles to learn more about series.
The only thing left to do is to specify the range of dates to be shown by default. We will set the range to the last 10 years of available data:
01 |
<?xml version="1.0" encoding="UTF-8"?> |
02 |
<stock xmlns="http://anychart.com/products/stock/schemas/1.9.0/schema.xsd"> |
Summary XML
So, here is the XML we have got after we are done with all these tricky manipulations:
01 |
<?xml version="1.0" encoding="UTF-8"?> |
02 |
<stock xmlns="http://anychart.com/products/stock/schemas/1.9.0/schema.xsd"> |
Final
Now the XML is ready, and we need to pass it to the component. Save it to a file named "config.xml" and pass it to the component using the
setXMLFile() method (you can learn more in Set Configuration as XML/JSON File).
Thus, your final JavaScript code should look like this:
When everything is set, the page with the chart is ready, and we can launch it. If everything was done as was shown here,
you can open the HTML page and see the chart that should look like this:

Here is a sample you could create yourself, ready to view, download and edit:
Online HTML/JavaScript Sample
