Scroller Data Provider
Overview
Scroller is used to navigate through the chart - zoom and scroll to the ranges of interest. To provide user an idea where the range of interest can be Scroller can display a small chart in its background.
In order to display this chart Scroller should know where this data is located - it needs Data Provider. This article describes all aspects of binding data providers to Scroller.

Data Provider by Default
All samples in the documentation and in the gallery use Data Provider by default option. Binding Data provider by id is pretty rare case and it is described in Data Provider by ID section.
Sample XML that you should have already seen in the number of other samples:
01 |
<?xml version="1.0" encoding="UTF-8"?> |
02 |
<stock xmlns="http://anychart.com/products/stock/schemas/1.9.0/schema.xsd"> |
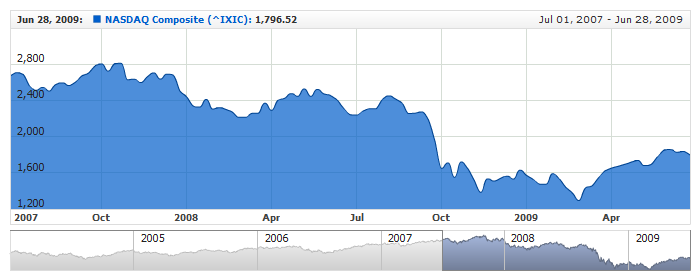
As you can see data provider for Scroller is defined in <scroller_data_provider> node, where you specify data set and the column index with the data, which is used to display a chart in the Scroller background.
Sample Chart with Scroller:
Live Sample: Scroller with Default Data Provider
Data Provider by ID
Binding Data Provider by ID is useful when chart is used in series are shown in Comparison Mode. If the initial XML contains declaration for all data sets and data provider, then all required CSV data is loaded and cached on the initialization stage.
As soon as it is done you can use external JavaScript setSettings method to add/remove series and technical indicators, which use data from Data Providers.
Usually scroller shows the small variant of the "main" series, series that interests us most at the moment, but when the such series is switched or new series if interest is added - you may want to change the small variant in Scroller.
To do so you can create several Scroller Data Providers in Data Providers list using several <scroller_data_provider> nodes, but you, in this case, need to set their names and define explicitly which one of them is used by the Scroller.
Sample XML below shows how to define several Data Providers and how to bind one of the, to the scroller:
01 |
<?xml version="1.0" encoding="UTF-8"?> |
02 |
<stock xmlns="http://anychart.com/products/stock/schemas/1.9.0/schema.xsd"> |
06 | sourceUrl: "./sample-data/ixic_daily_short.csv", |
22 | id: "customScrollerDP1", |
27 | id: "customScrollerDP2", |
As you can see <scroller_data_provider> node has id attribute, and each such attribute should have unique name. To bind certain data provider to the Scroller one should use data_provider attribute in <scroller> node, for example: <scroller data_provider="customScrollerDP2"/>.
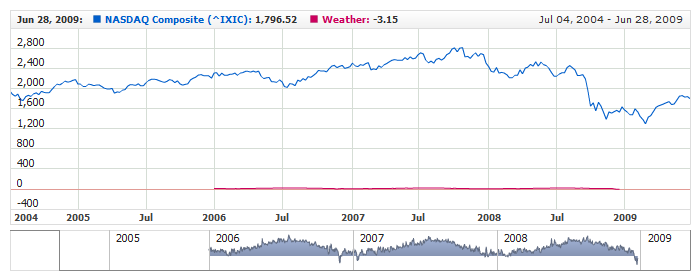
Sample below shows NASDAQ Composite(^IXIC) along with average temperature in Vancouver in the same period. Though, most likely, this phenomenon don't correlate we still can chart them at once and use temperature in Vancouver as the Scroller series:
Live Sample: Scroller with Custom Data Provider
Switching Data Providers
As it was said you can use setSettings method from AnyChart Stock JavaScript API
to change the Date Provider. Please take a look at the sample, which uses this method to switch data providers:
Online HTML/JavaScript Sample
Scroller without Data Provider
You may use Scroller without Data Provider and no series drawn in background - do so you just need to skip scroller data provider definition.
Sample XML of the chart with Scroller, but without series drawn in it:
Live Sample: Scroller Without Data Provider