XML/JSON Configuration Options
Overview
When you work with AnyChart Stock in HTML page you can set or update its configuration using special XML format or as a JavaScript object.
Both formats have pretty similar hierarchical structure, but still they differ in some features.
XML and JSON formats can be used to set initial configuration and update it later, but JSON format is also used to work with object model - thus, it is very handy to make small modifications on the fly (see Object Model article for more).
![]()
Online Samples
We recommend to read carefully all the information shown below and study all linked documents, but if you want to jump to the samples right now you can do that in:
XML Format
XML format is very useful to configure chart and can be validated using AnyChart Stock XML Schema (for example in XML Editor that supports schemas). This section briefly describes XML format and tools that help to utilize it efficiently.
Syntax
XML syntax used to configure AnyChart Stock is rather simple. Any full configuration starts with root tag (or node) <stock>, to which you can add any required settings as the subnodes with attributes.
Note: If you are not familiar with XML at all, please read XML Overview article before continuing reading.
Sample XML for basic chart configuration is shown below:
To learn about all possible nodes and attributes use XML Reference.
When you create initial XML settings manually it is highly recommended to use XML schema in XML editor to prevent obvious formatting errors. XML schema is described in details in AnyChart Stock XML Schema article.
If you, for some reason, can't use editor with XML validation - you can use online AnyChart XML schema validator: AnyChart Stock XML/JSON Validator.
![]()
XML Reference
XML reference provides a structured description of AnyChart Stock XML format - all nodes and attributes are annotated and put in a tree-structure. XML reference resides on AnyChart site and is always up to date.
Here is a sample XML Reference screenshot:
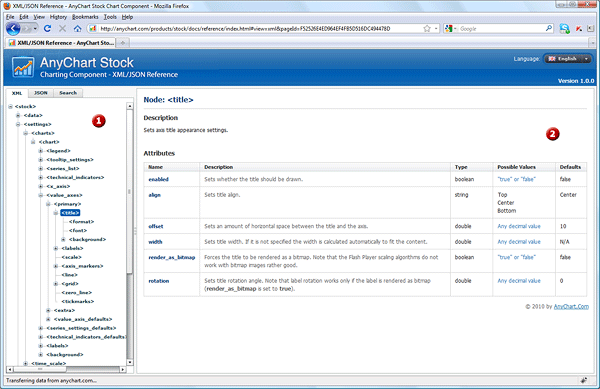
 XML Structure Tree - full XML structure shown as a tree, when you select any node - its description is shown in XML Node content.
 XML Node Content - selected node description, with all attributes, possible values and defaults.
XML Reference is located at:
![]()
How to apply to chart?
There are several options to apply XML config to the chart, depending on the task you can choose any of them:
- Set config as XML file or Replace XML config file
- Set config as XML string or replace XML config string
- Replace only settings as XML string
- Replace only event markers as XML string
![]()
JSON Format
For those who use JavaScript in their RIA and like it, AnyChart Stock provides an ability to set configuration as a JavaScript Object.
Besides the same areas of use as XML format has, JSON is used when you work with chart object model.
This section briefly describes JSON format and tools that help to utilize it efficiently.
Syntax
The syntax in JSON format is very simple: config is set in JavaScript Object Notation, with all required properties are defined.
Sample basic chart definition with JavaScript Object:
If you need to learn more about JSON specification, see:
![]()
JSON Reference
AnyChart Stock JSON format specifications are listed in JSON Reference, which is always up to date and located on AnyChart site.
Here is a sample JSON Reference screenshot:
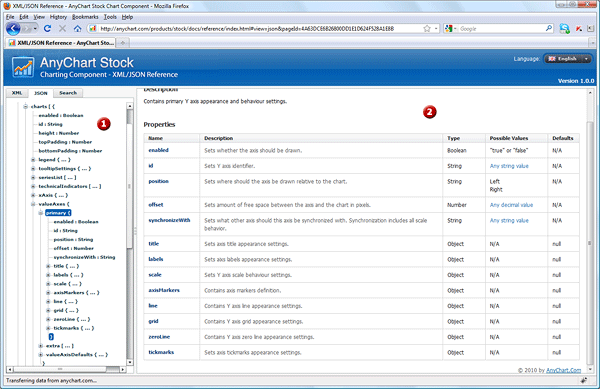
JSON Structure Tree - - full JSON configuration structure shown as a tree, when you select any object - its description is shown in Object Description Panel.
Object Description Panel - shows detailed description of an object or property selected in JSON Structure Tree.
JSON Reference is located at:
![]()
How to apply to chart?
There are several options to apply JSON config to the chart, depending on the task you can choose any of them:
- Set config as JSON file or Replace JSON config file
- Set config as JS Object or replace JS config object
- Replace only settings as JS Object string
- Replace only event markers as JS Object string
- Use JS Object to work with chart Object Model
JSON Format Specifics
When you set config in JSON format or work with object model you should keep in mind to specific moments:
Set date time using JavaScript Date class
There are a lot of attributes/properties in configuration structure, which values are timestamps, when you use XML based configuration you should follow exact format. Full list of such attributes can be found in Date-Time Values in Chart Settings article.
But when you use JSON settings, you can use either string value that follows this format or an instance of JavaScript Date class.
Methods below work with JSON, and use to set configuration, update it, add and update event markers - in this methods you can use Date instances to set date time values:
Caution: there is one important exception - setJSONFile() method. It sets config as JSON file and Date Time values in it should be set as string that follows "yyyy-MM-dd hh:mm:ss.fff" mask. Learn more about it in Date-Time Values in Chart Settings article.
If you are using object model to update chart configuration, all properties of DateTime type in objectModel property - are instances of Date class.
Two samples below show how to handle Date Time values using Date class instances:
Working with custom attributes
Some elements of chart support so called custom attributes - mechanism to add/store/display additional data.
Custom attributes are supported in:
In XML custom attributes are set as a list of sub nodes, but in JSON the list of custom attributes is an object with properties.
Here is a sample XML of event marker with custom attributes: switch from XML Code to JSON Code to see the difference:

01 | { |
02 | localeBasedDate: "2009-04-14", |
03 | attributes: { |
04 | Description: "Additional Information!", |
05 | Url: "http://www.anychart.com" |
06 | } |
07 | } |
As you can see in JSON structure custom attributes are the hash table: a set of properties of string type. Naming rules are the same as for any variable in JavaScript.
Custom attributes are very useful and may be used in many ways. For example, you can attach any data to the event marker and show when markers are clicked or hovered.
Samples below use custom attributes to store/show data, and you can find samples of working with them in JSON format:
![]()