Map Architecture
- Overview
- What are ".amap" files
- Custom Maps - SHP to AMAP Conversion
- Built-in Map Data
- Identifying map regions
- Attaching custom data to regions
- Adding interactivity to maps
Overview
We recommend you to to study How to create Simple Map tutorial, before reading this document, in which AnyChart Flash Map architecture is be explained.
Main ideas of AnyChart Flash maps are:
- AnyChart uses single swf file to render any map.
- AnyChart gets the map data from ".amap" file.
- Map settings and data are stored in XML file.
AnyChart.swf is an almighty engine that is able to create a number of chart types with different orientations and visualization options, and "Map" is a special plot_type that allows you to display Flash maps on your web-pages almost the same way as charts are created.
The only difference between charts and maps is the fact, that map itself (the shapes of regions, their names, geographical coordinates, etc.) is stored in a separate file with "amap" extension. (Read more about "amap" files below).
You can place an swf file, amap file, xml file (or server-side script that creates XML file) to your server and with a small piece of JavaScript code add interactive Flash Maps to your web-site or web-application.
![]()
What are ".amap" files
".amap" files are maps encoded in a proprietary AnyChart format created to store geographical data. Each ".amap" file contains a single map, for example: Map of the USA divided into Single states, or Map of USA divided into single Counties.
Each file contain information about geographical coordinates and shapes of regions, along with some additional data (for example FIPS codes of states). You don't have to know actual format of these files - AnyChart parses all information automatically - all you have to do is to create XML settings file, that tells AnyChart engine to load certain map and define how it should be displayed.
There are a lot of ".amap" files shipped with AnyChart package at no additional cost, full list of them can be found in Available Maps List.
AMAP and IIS (Microsoft Internet Information Server)
To make amap files for AnyMap work with IIS (Microsoft Internet Information Server):
- Open Internet Information Services (IIS) Manager
- Right Click [Default] WebSite -> Properties -> HTTP Headers Tab
- Mime-map Section: File Types.. Button
- Click to "Add..."
File name extension: .amap
MIME Type: application/octet-stream
Custom Maps - SHP to AMAP Conversion
Moreover - we can convert ANY file in SHP format into ".amap" format - so if you have your own SHP files, that contain map of regions you need to display in web - contact us and we will convert your files into ".amap".
Converted ".amap" files can contain any information provided in SHP file, for example localized names or statistical data.
Read more and look at the sample fo custom map in ESRI ShapeFile (SHP) Support Tutorial.
Just send a letter with a request to: support@anychart.com and we will contact you in a timely manner.
![]()
Built-in Map Data
As it was said above - each ".amap" file contain not only map regions data itself, but also some additional information, to know what additional information is included into a file - open the reference page of certain map and look at the data table, for example here is a map reference of USA map without Alaska and Hawaii.
As you can see the map consists of 49 regions and each region has the following data attached: REGION_ID, REGION_NAME, STATE_FIPS and SUB_REGION_NAME.
![]()
Identifying map regions
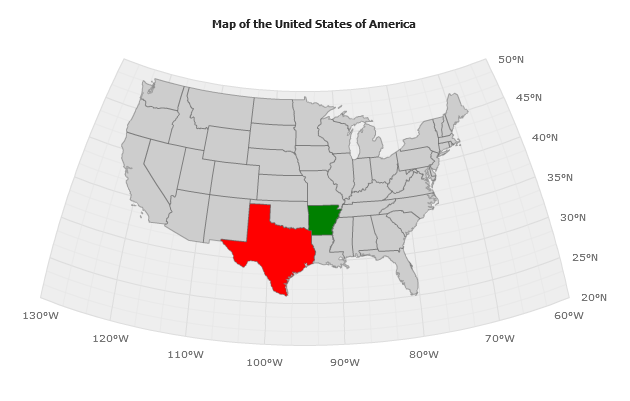
Built-in data can be used to identify region on the map and, for example, create color map that shows some statistical data. To color certain region you need to create <series> of "map" type and create <point> in it, that has a name that matches some REGION_ID from map reference.
Here are sample XML settings for "MapRegions" series:

01 |
<data> |
02 |
<series type="MapRegions"> |
03 |
<point name="TX" color="Red" /> |
04 |
<point name="AR" color="Green" /> |
05 |
</series> |
06 |
</data> |
And here is a sample map with such series configured:
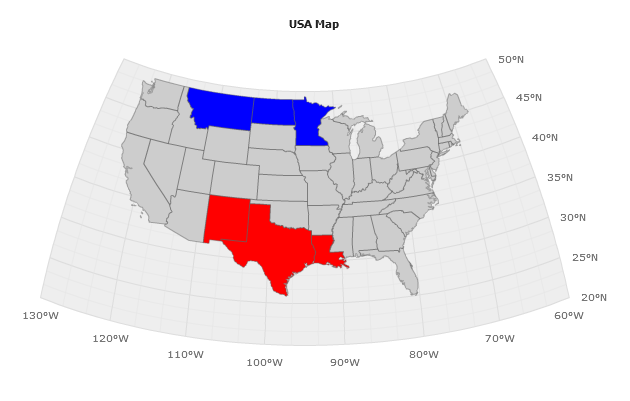
You can create several series to group regions by color, sample XML settings are:
01 |
<data> |
02 |
<series type="MapRegions" name="North" color="Red"> |
03 |
<point name="TX" /> |
04 |
<point name="AR" /> |
05 |
</series> |
06 |
<series type="MapRegions" name="South" color="Red"> |
07 |
<point name="TX" /> |
08 |
<point name="AR" /> |
09 |
</series> |
10 |
</data> |
These settings allow you to display map like that:
![]()
ID Columns
Important note - almost all ".amap" files contain several data fields for each region, and several of these fields can be used as identifier column. By default AnyChart uses REGION_ID column to identify regions, but if your database uses another field for region identification - you don't need to decode it, just set id_column attribute in <map_series> node.
A key icon near the column name means that this field can be used as identifier (primary key, in terms of relational databases).
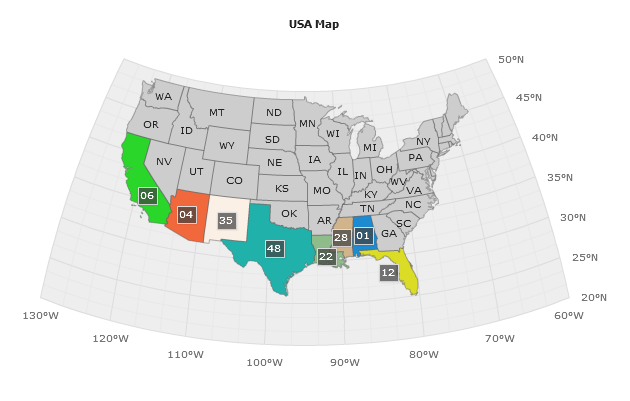
In the sample below we will use FIPS codes of states to identify them:
01 |
<map_series source="usa/country/states_48.amap" id_column="STATE_FIPS" /> |
All south coast states with FIPS 01, 04, 12, 22, 28, 35, 48 (Alabama, Arizona, California, Florida, Louisiana, Mississippi, New Mexico, Texas) colored and labels with FIPS placed on them (tooltips show names), all other states show names and FIPS in tooltips:
![]()
Attaching data to regions
With AnyChart you can not only create simple color maps, but attach any custom data values to map regions and then display this data in labels, tooltips or legend, and use this data for automatic coloring (using thresholds) or pass this data to external environment (use it in actions and get in in event handlers).
In the sample below some custom data is attached to the map of United Kingdom - launch the live preview and see information about Population, Area, GDP of this regions, along with Patron Saint name.
Learn how to attach data to maps in Attaching data to map regions tutorial.

![]()
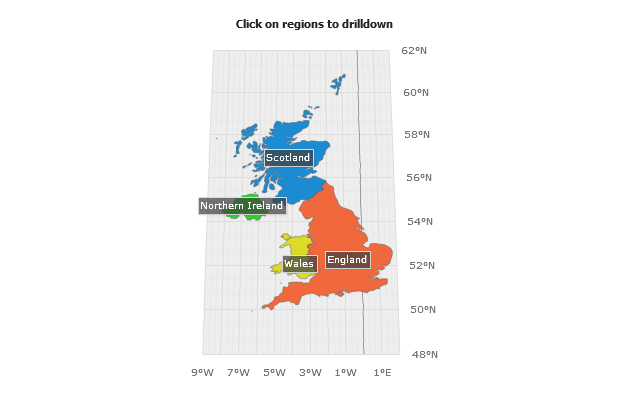
Adding interactivity to maps
With AnyChart you can make all maps interactive - i.e. create drilldown maps, dashboards and launch certain functions on regions click, in this tutorial we will only demonstrate two options: Drilldown map of UK, and USA Map with "Open WEB page" feature attached. To learn more about Interactivity - study the Map Interactivity Tutorial and Maps in Dashboards Tutorial.
United Kingdom Drilldown Map Sample
Drilldown sample of United Kingdom is created using AnyChart Dashboard Option - launch the live sample and click on sub regions to drilldown to sub region map:
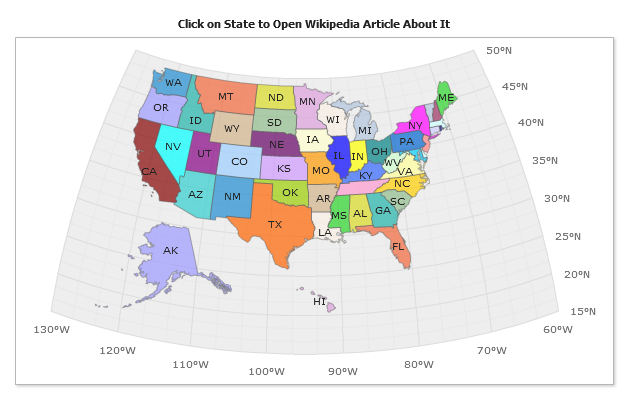
USA Open a Web Page On State Click Sample
This map uses only data provided in ".amap" file, default pallette is applied to color the map and action defined for any state - to open certain Wikipedia Page - launch the live sample and click on states to read about them in Wikipedia (actually, we've known a lot of interesting stuff while creating this tutorial).
![]()