Adding Actions to Maps
- Overview
- Regions States
- Regions Actions
- Open web page on region click - navigateToURL
- Launch an external function - call
- Update Map - updateChart action
- Update Map in Dashboard mode - updateView
- Custom Attributes in Actions
- Events Dispatched by AnyChart
- AnyChart External Functions
Overview
AnyChart offers you a wide variety of option that allow to make maps really interactive:
- You can control appearance of regions depending on user action - use element states for that.
- You can define a set of actions that should be performed when user clicks a regions on a map. Action can open the certain web page, call an external function (JavaScript, for example), reload the chart itself or another chart (in dashboard mode).
- AnyChart dispatches events that can be handled in an external environment (JavaScript, for example)
- External environment can call AnyChart Functions to load data to the chart.
![]()
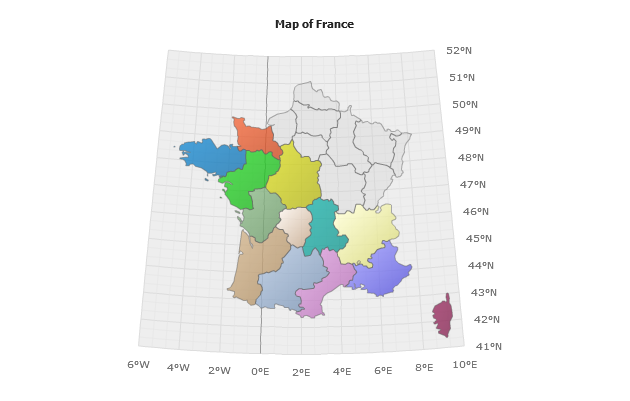
Regions States
Each region (doesn't matter if this is a point or map region) in AnyChart Charts has several states, states are changed when user interacts with a map.
In the sample below we defined states for regions that have data attached, and for those that do not - the regions with data will be colored and non-transparent, when user pushes them - color will be more dark, when selects - hatch filled, regions with no data attached will be almost transparent in normal state, unselectable and grey and semi-transparent.
Also note that you can select several regions on the map clicking on them ine by one, and unselect them clicking on selected region again.
![]()
Items Actions
You can define one or several actions be performed when user clicks a point on a map, typical action settings for region looks like, it will open a page with paramters passed in URL:

01 |
<point name="USA" y="10"> |
02 |
<actions> |
03 |
<action type="navigateToURL" url="http://www.anychart.com/?param={%Name}" target="_blank" /> |
04 |
</actions> |
05 |
</point> |
There are several types of actions:
| Type | Description |
|---|---|
| navigateToURL | Used to open certain web page, may be used to call JavaScript functions. |
| call | Used to call for external functions, may be used to call JavaScript functions. |
| updateChart | Used to update the current map data. |
| updateView | Used to update a certain view in dashboard mode. |
![]()
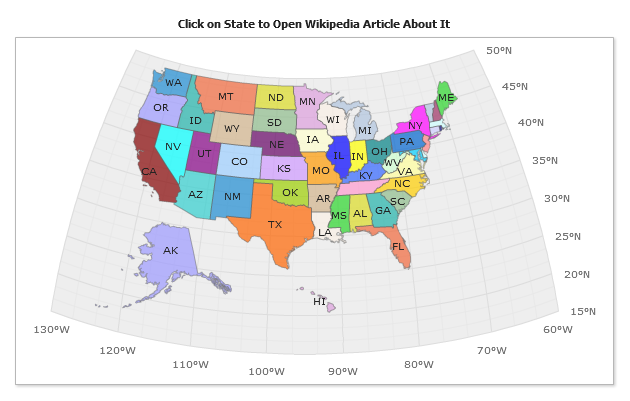
navigateToURL
navigateToURL action allows you to open a web page or launch a JavaScript (however call action is more preferable to launch external functions), url attribute specifies an address, target - a target for the page:
In the sample below we will show how to add open page with parameters on click of any region on the map:
01 |
<undefined_map_region palette="default"> |
02 |
<actions> |
03 |
<action type="navigateToURL" url="http://en.wikipedia.org/wiki/{%REGION_NAME}" target="_blank" /> |
04 |
</actions> |
05 |
</undefined_map_region> |
You can see that we have set for all undefined regions (and all regions in this map are undefined - we don't have any data section at all) to open Wikipedia URL that is created from http://en.wikipedia.org/wiki/ and {%REGION_NAME}, where region name is a data built-int into AnyChart ".amap" file, launch the live sample, click on different states and see how it works.
![]()
call
call action type is used to launch a function in an external environment - this can be JavaScript, or .Net, or Flash - any environment that can interact with Flash Movie.
You should specify the name of a function and arguments values (if any):
01 |
<point name="England" y="10"> |
02 |
<actions> |
03 |
<action type="call" function="alert"> |
04 |
<arg><![CDATA[Test Alert Function]]></arg> |
05 |
</action> |
06 |
</actions> |
07 |
</point> |
This sample launches "Alert" function:
![]()
updateChart
updateChart is used to update map from an external or internal source. This action can be used to create drill-down maps.
You have to specify if the source is external, or internal and specify the name of the chart within <charts> node in the current XML, or an URL of XML file (or script), that return XML with <chart> node with chart data:
01 |
<point name="P1" y="10"> |
02 |
<actions> |
03 |
<action type="updateChart" source_mode="internalData" source="DrillDown" /> |
04 |
</actions> |
05 |
</point> |
In this sample we will use an advanced feature of updateChart action - replace token option, the action defined like that:
01 |
<action type="updateChart" view="State" source_mode="internalData" source="State"> |
02 |
<replace token="{$region_amap}"><![CDATA[{%REGION_ID}]]></replace> |
03 |
<replace token="{$title}"><![CDATA[{%REGION_NAME}]]></replace> |
04 |
</action> |
Which means that AnyChart will take "State" chart XML and replace {$region_amap} and {$title} tokens by {%REGION_ID} and {%REGION_NAME} keywords values, which allows us to create drill-down map for all USA with a rather easy and compact settings (you can view them in live sample XML preview), also note that we are using updateChart action to create "Back" button.
![]()
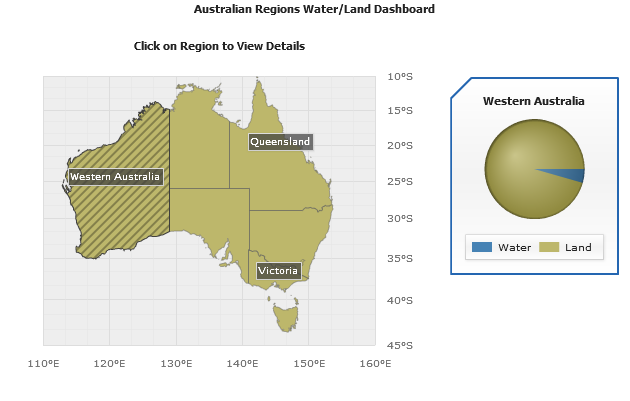
updateView
updateView is used to update a part of dashboard when dashboard mode is used.
You have to set a name of a view that should be updated, choose whether source will be internal or external and specify the source itself:
01 |
<point name="P1" y="10"> |
02 |
<actions> |
03 |
<action type="updateView" view="SecondaryChart" source_mode="externalData" source="Data2.xml" /> |
04 |
</actions> |
05 |
</point> |
In the sample chart below you can click on Australia regions on the left and pie chart showing how land and water area contribute to whole region area to the right will be displayed:
![]()
Custom Attributes in Actions
In the sample above AnyChart gets attributes attached to map regions and passes them to Pie Chart, you can use custom attributes and/or any keywords provided.
In call sample we've shown passing custom attributes values to JavaScript Alert function.
In AnyChart you can attach custom attributes to points and series, that can store any additional data to be used in tooltips, labels, legend and actions. Custom attributes are described in details in Custom Attributes section of Keywords and formatting tutorial.
![]()
Events
When user interacts with a map AnyChart dispatches events that can be handled in an external environment (JavaScript, for example). This events supply to external environment all available data about map and a region, so it is possible to implement a complex business logic, based on the data supplied.
Sample handling and a reference of data available on events dispatch can be found here:
Java Script Events Handlers on Map
![]()
AnyChart External Functions
You can set XML to AnyChart from an external environment (JavaScript, for example) there are two functions that allow you do do that: setXMLFile and setData.
Function setData(xmlData) sets chart configuration XML from xmlData .
Sample usage:
- Set XML from TextArea: read description of setting XML as String from <textarea>
Function setXMLFile(xmlPath) sets the path to file with AnyChart XML.
Sample usage:
- Changing map xml at run-time: how to change map XML file at a run-time
![]()