Creating Event Markers
Overview
This article covers the mechanism of adding Event Markers to a chart in the configuration file. The component is capable of displaying a large number of event markers; technically, you are not anyhow restricted when forming the list. However, using more than 3000 markers simultaneously is not recommended, as it may seriously downgrade the performance of the component.
The actual event markers are defined in the <event_markers> node, located at the following nesting level of the XML structure:
01 |
<?xml version="1.0" encoding="UTF-8"?> |
02 |
<stock xmlns="http://anychart.com/products/stock/schemas/1.9.0/schema.xsd"> |
The complete structure of the node along with all possible event marker element settings can be learnt in XML Reference.

Declaring Event Markers in Configuration File
Event Markers are added to chart as the so-called "groups", which are technically collections of event markers. Using groups is very convenient, as they allow adding visual and functional settings for a whole set of markers without creating configuration duplicates for each marker.
Declaring and Customizing Group
Here is a listing showing where groups are to be added:
01 |
<?xml version="1.0" encoding="UTF-8"?> |
02 |
<stock xmlns="http://anychart.com/products/stock/schemas/1.9.0/schema.xsd"> |
As you can see on the listing, groups are declared as a set of the <group> nodes, the number of which is not limited...
Event markers cannot appear on a chart on their own; they (or, to be exact, the group) need a data series they are going to be bound to. Each group _must_ have a chart identifier and series identifier on that chart that the group of event markers would be bound to.
Take a look at this listing - identifiers are set for the chart and for the series. For the chart that's idMainChart, and for the two series - idSeries1 and idSeries2:
01 |
<?xml version="1.0" encoding="UTF-8"?> |
02 |
<stock xmlns="http://anychart.com/products/stock/schemas/1.9.0/schema.xsd"> |
The next listing demonstrates using these identifiers for binding groups of event markers to data series:
01 |
<?xml version="1.0" encoding="UTF-8"?> |
02 |
<stock xmlns="http://anychart.com/products/stock/schemas/1.9.0/schema.xsd"> |
As you can see on the listing, the <group> node has two attributes: chart and series. To bind a group of event markers to a specific series, chart attribute must accept the identifier value of the chart the series is located on, and the series attribute - identifier of the series on the chart the group of markers would be bound to.
Binding groups of event markers is covered in different variations accompanied by live examples in Binding to Series in Different Variations.
Here is the table of all attributes, available in the <group> node:
| Attribute |
Possible Values |
Description |
| chart |
Any existing chart identifier. |
Mandatory parameter. Chart identifier, containing a series, which the group of event markers is to be bound to. |
| series |
Any existing series identifier. |
Mandatory parameter. Series identifier, which the group of event markers is to be bound to. |
| id |
Any string. |
Group identifier used by external methods for different operations over the group. |
| visible |
true
false |
If this attribute is set to false, this group of markers will be invisible. Later on, when using the chart on a page, you can make the group be visible by using the external showEventMarkerGroup method. |
| direction |
Up
Down |
Defines the drawing direction for markers of the group. |
| position |
Axis
Series
SeriesPositive
SeriesNegative |
Defines the position for plotting markers that belong to the group. |
| format |
Any text character. |
Defines the character to be displayed over all event markers in this group. |
| field_type |
Low
High
Open
Close
Value
Volume
Custom |
Together with field_custom_type_name attribute determines a field of the referenced series data provider that is used to determine anchor Y position for all elements of this group (if the group is not set to be placed on an axis). Learn more. |
| field_custom_type_name |
String |
Together with field_type attribute determines a field of the referenced series data provider that is used to determine anchor Y position for all elements of this group (if the group is not set to be placed on an axis). Learn more. |
The use of some of these attributes is covered in Event Markers: General & Visual Settings.
Adding Events to Group
Once you have a group added and bound to some data series, you need to fill it up with event markers.
Markers are added as a list to the <events> node; the number of the markers is not limited. An event marker is described in the <event> node. Below is the sample XML syntax for adding markers to group:
In each <event> node, you must specify its timestamp using the date or locale_based_date attribute to define the date it is bound to, date has the fixed format and locale_based_date can be defined in <locale> node.
More detailed description of configuring or not configuring locale and setting timestamps for event markers is available in Event Markers: Date-Time Input Locale and article.
Here is the complete list of attributes, available in the <event> node:
| Attribute |
Possible Values |
Description |
| date |
Timestamp in fixed chart settings format. |
Timestamp this event marker would be bound to. Timestamp is set as a string and must comply with the format defined in Date Time Values in Chart Settings. Either this or locale_based_date attribute should be defined, but this has the priority, if both are specified. |
| locale_based_date |
Timestamp value according to the locale format. |
Timestamp this event marker would be bound to. Timestamp is set as a string and must comply with the format defined in the <locale> node of the group this event marker is added to. Either this or date attribute should be defined. |
| id |
String identifier. |
Sets string identifier, which enables using this event marker by external methods. |
| selected |
true
false |
If this attribute is set to true, this event marker will be selected. By default the parameter is set to false. |
| visible |
true
false |
If this attribute is set to false, this event marker will be invisible. Later on, you can make it visible by using the external method showEventMarker. |
| direction |
Up
Down |
Defines the drawing direction for the event marker. |
| position |
Axis
Series
SeriesPositive
SeriesNegative |
Defines the position this event marker will be plotted at. By default, it is set to Series. |
| format |
Any text character. |
Defines the character to be displayed over this event marker. |
The use of some of these attributes is covered in Event Markers: General & Visual Settings.
Here is the first final live sample that demonstrates how you can add event markers with the configuration file:
Live Sample: Event Markers
There is another way for adding event markers, bypassing the configuration file - that's adding the markers with the JavaScript library supplied with the component. With this library, you can dynamically add, delete and modify existing event markers on the chart.
Handling event markers with the JavaScript library is covered in a bunch of samples in Online HTML/JavaScript Samples Center: Working with Event Markers section.
Binding to Series in Different Variations
A group of event markers can be bound to any data series and even to technical indicators. It is also worth noticing that the binding works in any value axis mode; for example, in the comparison modes, covered in Y-Axes Settings.
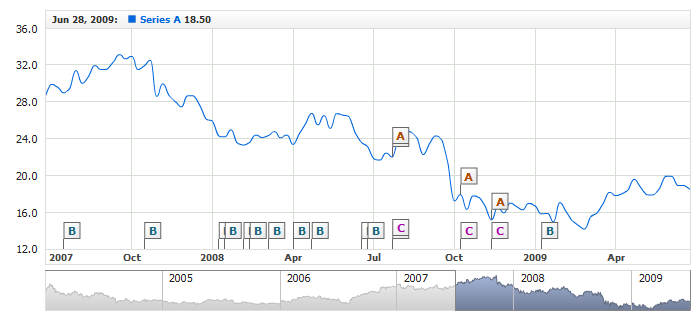
1. Example - One group of markers is bound to one series:
Live Sample: Binding Event Markers - Single Chart and Single Series
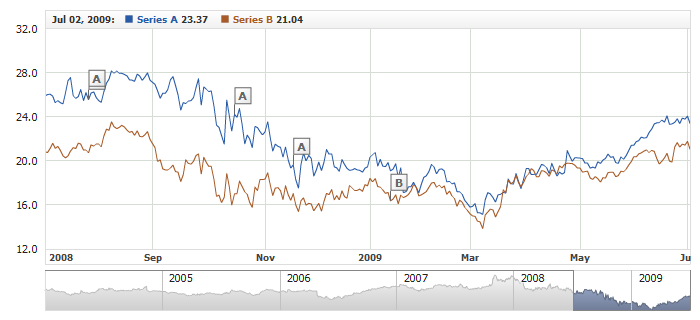
2. Example - Two series with one group of markers bound to each series:
Live Sample: Binding Event Markers - Single Chart and Two Series
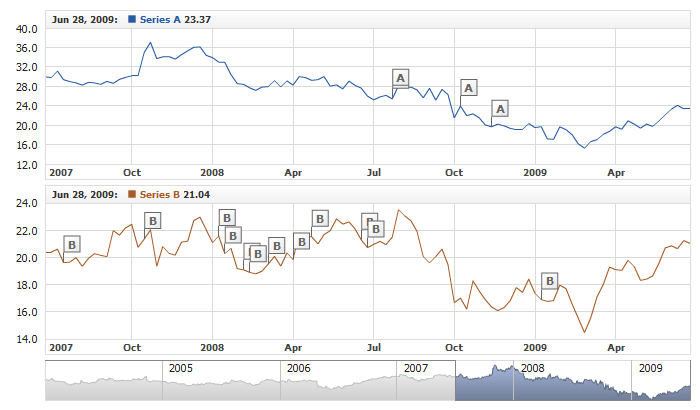
3. Example - Two charts with one series on each chart and one group of markers bound to each series:
Live Sample: Binding Event Markers - Two Charts and Two Series
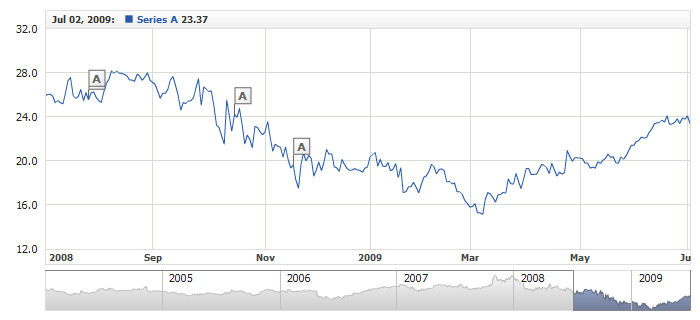
4. Example - One series with two groups of markers bound to it. The value axis is in the PercentChanges mode:
Live Sample: Binding Event Markers - One Series and Two Event Marker Groups
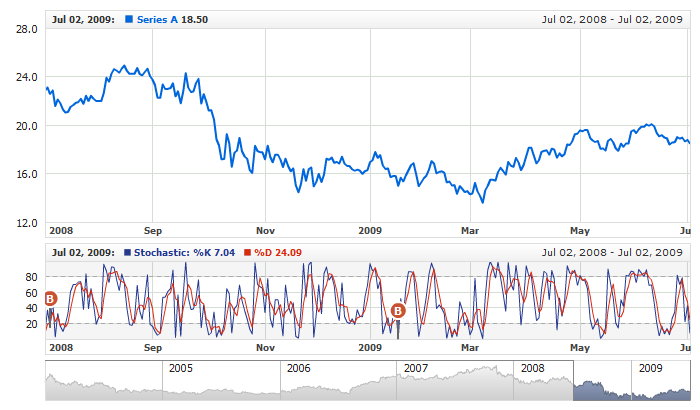
5. Example - Binding a group of markers to a series visualizing one of the parameters of the Stochastic Oscillator technical indicator:
Live Sample: Binding Event Markers - Technical Indicators
Using Custom Attributes
Each event marker can carry the so-called custom attributes, which in the essence are the accompanying data set in the format of string values with some identifier. Later on, you can use that data in tooltips or process it when obtaining events from event markers.
Below is the XML syntax for adding custom attributes to an event marker:
03 |
<attr name="Desc"><![CDATA[Additional Information!]]></attr> |
04 |
<attr name="Url"><![CDATA[http://www.anychart.com]]></attr> |
04 | Desc: "Additional Information!", |
05 | Url: "http://www.anychart.com" |
As you can see on the listing, custom attributes are set as a list in the <attr> node, each one of which requires an identifier specified in the name parameter; e.g.: <attr name="Url">. The value of the attribute is to be defined inside the <attr> node. When using special characters, make sure to use the CDATA block.
For an example of using custom attributes, we could review a live sample using the standard tooltips for event markers:
Live Sample: Event Markers - Using Custom Attributes in Tooltips
The detailed coverage for using built-in tooltips is available in Event Markers: Using Tooltips.
Besides that, custom attributes can be obtained when processing events from event markers. Here are the custom samples that use such technique:
Online HTML/JavaScript Sample
Online HTML/JavaScript Sample
Online HTML/JavaScript Sample