Missing Points Control
Overview
AnyChart Stock has three built-in way to display series values:
When user hovers some area on the data plot, he hover some timestamp and at this moment legend or tooltip can show the data value associated with this timestamp: series or technical indicators values.
Everything is fine if there is a data to be shown, but what if some series doesn't have a value bind to this timestamp?
By default component handles this situation somehow, but also engine provides you a total control over this situation: this article lists all possible situations which lead to "missing values" in the series and all available options of handling such situations.
Is is recommended that you study Missing Points Cases and Missing Points Main Question before you proceed to actual settings and attributes - "missings" are as simple, as it may seem.

Missing Points Cases
There are three situations how "missing value" can appear in the chart, these are situations, which make engine turn on "missing rules behavior":
1. Empty time spans in a series
CSV tables you use in data sets can contain empty values: you can specify timestamp, but omit values. Working with Data: Input Data Settings article can tell you more about this, if needed.
Here is a sample CSV data set with several rows with empty values:
08 |
<csv_data><
2. Several series with heterogeneous timestamps
Another widespread situation when missings appear is when series are based on heterogeneous data.
There are two basic situations here:
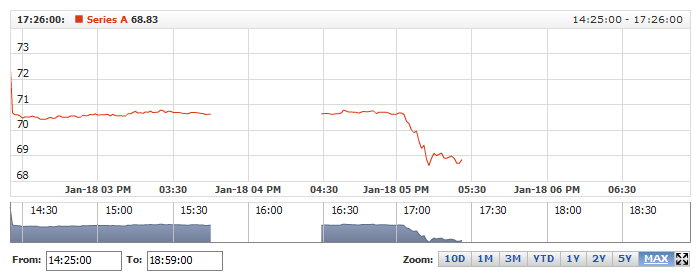
2.1 Series based on different time ranges
For example we have two series, one has data on 2010-01-01 - 2011-01-01 interval, and another on 2010-05-1 - 2011-05-01 interval; for both series we have a daily data.
As the result: one series starts earlier and in 2010-01-01 - 2010-05-01 range and for this range another series values are "missing".
The same applies to 2011-01-01 - 2011-05-01 range - here we have "missings" for one of the series.
Illustration below shows what we are talking about:
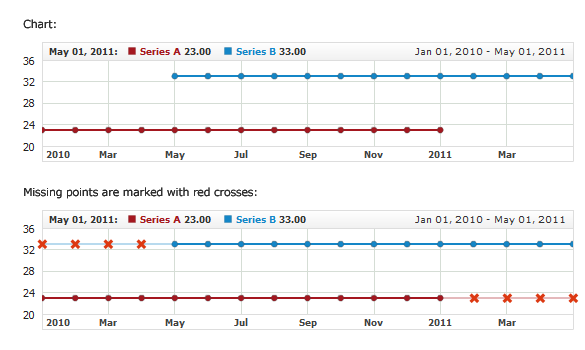
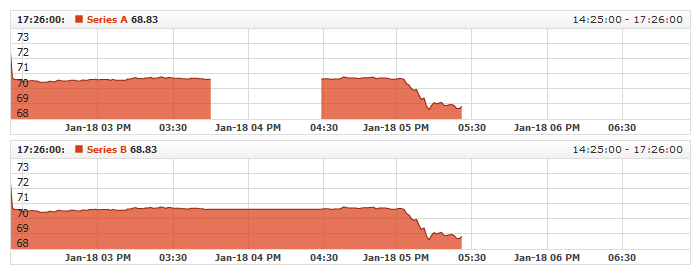
2.2 Same time range, but different intervals
Another way how "missing" appear is the situation when series are based on the same (or almost the same) time range, but intervals differ.
For example we have two series and each has six points, in the first one timestamps are: 2010-01-01, 2010-03-01, 2010-05-01, 2010-07-01, 2010-09-01, 2010-11-01; and in the second one: 2010-02-01, 2010-04-01, 2010-06-01, 2010-08-01, 2010-10-01, 2010-12-01.
So, although time range is similar - there is no data for each timestamp for one of the series. Illustration shows this situation:

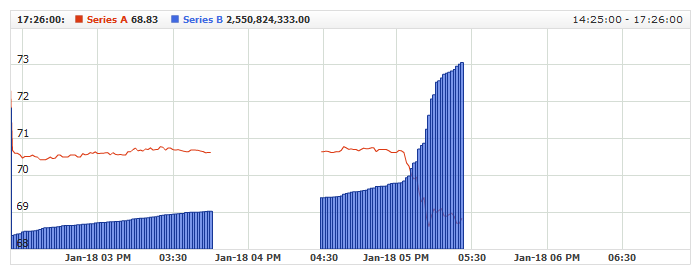
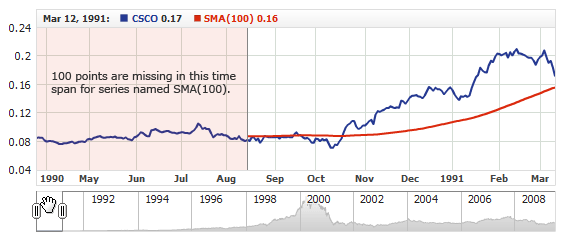
3. Technical indicators based on Moving Average algorithm
Most of the indicators in the component are based on moving average. To calculate MA a certain amount of "previous" data is needed: these points can be seen in data series, but there is no data for indicator series here - and we have "missings" again.
For example we have SMA(100) indicator, which means that first hundred of values is needed for calculation and it starts drawing from 101 point. Take a look at the illustration below: "missing" area of SMA(100) series is marked in red.
Conclusion
We have tried to cover most popular cases when one might need to have an access to the additional configuration options for "missing" points. Below we will first ask Main Missing Point Question and then list all configurable attributes and tell you how they affect charts - these attributes answer the question and allow you to control missing points.
Missing Points Main Question
The main question one needs to answer when he works with missing points is: if point is missing - what should I do? Obvious answers are:
- do nothing, ignore them, hide the fact, that something is "missing";
- do something and show something instead of "missing".
AnyStock engine allows you to do both: depending on your application logics you can implement any possible case.
As we have already said in overview and as you may already know: missing values can appear in tooltips and legend - you can control their behavior separately, but the way engine searches for substitute is the same for all of them. Please proceed to the Search Rules to learn about this. If you want to make component ignore missing values, then, probably, the only section you need is Forbid Missings Highlight.
Connect Missings Points
Another important thing you may need to configure when working with missing points is connect_missing_points attribute which is important for line and area series, it defines whether line or area should be joined or not:
01 |
<?xml version="1.0" encoding="UTF-8"?> |
02 |
<stock xmlns="http://anychart.com/products/stock/schemas/1.9.0/schema.xsd"> |
Sample chart below contains two charts with series based on the same data set, but one is joined and another
shows a span. Please note, that this attribute only connects - that is why area is blank at the end.
Live Sample: Missing Values - Connect Lines and Splines
Forbid Missings Highlight
In one of the most popular cases you may want to show empty spans in areas, where data is missing and, at the same time, forbid
highlighting in this area, because there is nothing to show. To do so you need to set skip_missing_points_on_highlight
attribute to true:
| Attribute |
Possible Values |
Description |
| skip_missing_points_on_highlight |
True
False |
Sets whether the component should look for a proper point to be highlighted if currently highlighted point is recognized as missing.
The lookup is made in the direction set by existing_point_search_rule attribute. |
Sample XML/JSON snippet:
01 |
<?xml version="1.0" encoding="UTF-8"?> |
02 |
<stock xmlns="http://anychart.com/products/stock/schemas/1.9.0/schema.xsd"> |
And here is a simple chart, where you can see how this works: hover the empty ranges and you will see that date time highlighter
disappears there:
Live Sample: Missing Values - Forbid Highlight
Note: the choice of the point to which highlighter "sticks to" when you hover missing area is defined by Search Rules described in the next section.
Search Rules
When point is missing and engine searches for substitute you can tell where to search for it using existing_point_search_rule attribute:
01 |
<?xml version="1.0" encoding="UTF-8"?> |
02 |
<stock xmlns="http://anychart.com/products/stock/schemas/1.9.0/schema.xsd"> |
This attribute defines the general rule, that applies the whole chart. Table below contains all possible values:
| Attribute |
Possible Values |
Description |
| existing_point_search_rule |
GetNearest
GetLeft
GetRight |
Sets what non-missing point the component should prefer if point is missing. |
The meaning of this attribute is pretty straightforward if you remember the cases - missing points are either before, after or in the middle, and when you search for substitute, you need to decide where to look for it.
Display Settings Rules
Rules listed above are applied when you work with legend or tooltips, where you have two more attributes to be used, to avoid excessive explanations we offer you to look though their description:
| Attribute |
Possible Values |
Description |
| search_for_existing_point |
True
False |
Tells the component to search an appropriate point with non-empty value, if First, Last or Current property of {%Date}, {%Value}, {%ValueChange}, {%PercentValueChange} or any other token have returned an empty value. |
| hide_element_on_missing_value |
True
False |
If set, tells the component to hide the entire element if any token in its format have returned empty value. Otherwise, only the token value itself will be hidden. |
First of all you need to understand that these attributes make sense only when missings are not skipped by Forbid Highlight because when you skip the missings - they "doesn't exist" for user at all, but when highlight is allowed user moves the mouse over empty areas and we have to decide what to show him.
Lets now proceed to sample configurations we have provided below, each sample is commented and you will understand how rules and attributes work with each other, and how you can control the behavior of different elements.
No search enabled - Different hide options
If you set search_for_existing_point to "false", then engine doesn't search for substitutes when user hovers empty areas, but you have two options: set
hide_element_on_missing_value to "true" or
"false"
When
hide_element_on_missing_value is set to "true" - the whole element, like tooltip, for example, is hidden, and if it is set to "false" - only token, that returns an empty value, is hidden.
Please take a look at the live sample below, it contains to charts: in the first one we hide elements, in the second one - only tokens:
Live Sample: Missing Values - Hide Token or Element
Search enable - Search Rules applied
When search_for_existing_point is set to true - it almost always finds a substitute, and
hide_element_on_missing_value almost never used, but in rare cases, when substitute can't be found - it would work as described above.
Rules were described earlier - when user hover an empty space component tries to find the point from the same series to show it instead of missing one, depending on the rule it may be the Nearest point (default: GetNearest) or the first non-empty point to the left (GetLeft) or to the right (GetRight).
Please make sure you understand why you need to change the rule if you do so: nearest point is almost always the best choice.
Sample below shows how component shows the nearest point:
Live Sample: Missing Values - GetNearest Search
And the next sample shows the point to the left search mode. Note that there is no difference between GetLeft and GetNearest, when you hover the big empty span in the left side of the chart, but in another span it always shows one value, unlike previous sample, which switches from left nearest point to right nearest point:
Live Sample: Missing Values - GetLeft Search