Fibonacci Retracement Annotation

Overview

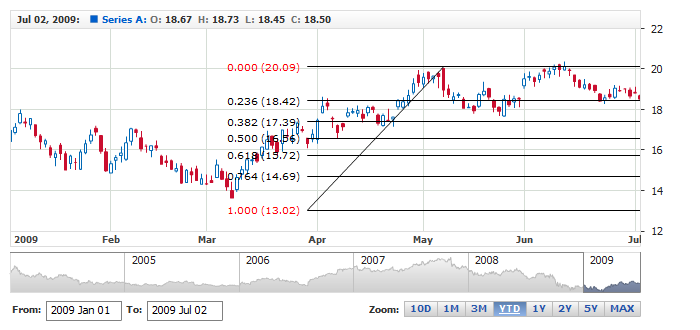
Fibonacci retracements are a method of technical analysis for determining support and resistance levels. They are named after their use of the Fibonacci sequence. Fibonacci retracement is based on the idea that markets will retrace a predictable portion of a move, after which they will continue to move in the original direction.

Fibonacci Retracement annotation allows to add this type of drawing to the chart, as any other annotation it can be drawn by user or added to the chart via XML or JSON settings. In this article you can learn how to add it via XML or JSON settings and what visual settings can be done.

To learn about basic settings, that can be done with an annotation please refer to: Drawing Tools and Annotations: General Settings.

to top

Adding annotation via settings

To add a Fibonacci Retracement annotation to a chart you need to, as with any other annotation, add an annotation node, assign the id, set "FibonacciRetracement" type and specify the chart id using chart attribute.

In fibonacci_retracement_annotation node you need specify value and time anchors, which define two points needed to draw this type of annotation.

All this you can see in the basic XML/JSON snippet below:

XML/JSON Syntax
Plain code
01 <?xml version="1.0" encoding="UTF-8"?>
02 <stock xmlns="http://anychart.com/products/stock/schemas/1.9.0/schema.xsd">
03   <annotations>
04     <annotation_list>
05       <annotation id="FRetracement_0856719161" type="FibonacciRetracement" chart="idMainChart">
06         <fibonacci_retracement_annotation color="#DB2A0E" first_time_anchor="2009-03-30" first_value_anchor="16.02" second_time_anchor="2009-05-07" second_value_anchor="20.09" />
07       </annotation>
08     </annotation_list>
09   </annotations>
10 </stock>
01{
02  annotations: {
03    annotationList: [
04      {
05        id: "FRetracement_0856719161",
06        type: "FibonacciRetracement",
07        chart: "idMainChart",
08        fibonacciRetracementAnnotation: {
09          color: "#DB2A0E",
10          firstTimeAnchor: "2009-03-30",
11          firstValueAnchor: 16.02,
12          secondTimeAnchor: "2009-05-07",
13          secondValueAnchor: 20.09
14        }
15      }
16    ]
17  }
18}

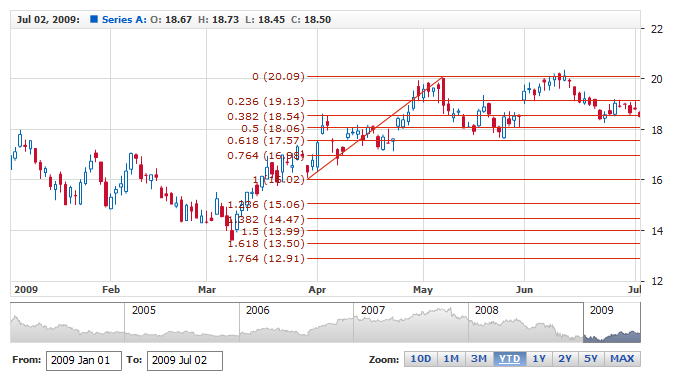
Live sample below shows a chart with this sample basic Fibonacci Retracement annotation:

Live Sample:  Adding Fibonacci Retracement Annotation

to top

Levels

Since version 1.7 you have an option to choose what levels are displayed and even specify the ratio of levels. It is done in <levels> node, like shown in the snippet below. Please note, that this snippet also shows default levels and ratios: you can define any number of levels and set any ratio in value attribute, even if these values do not match Fibonacci sequence.

XML/JSON Syntax
Plain code
01 <?xml version="1.0" encoding="UTF-8"?>
02 <stock xmlns="http://anychart.com/products/stock/schemas/1.9.0/schema.xsd">
03   <annotations>
04     <annotation_list>
05       <annotation id="FRetracement_6918927152" type="FibonacciRetracement" chart="idMainChart" axis="primary" allow_edit="true">
06         <fibonacci_retracement_annotation color="#DB2A0E" first_time_anchor="2009-03-30" first_value_anchor="16.02" second_time_anchor="2009-05-07" second_value_anchor="20.09">
07           <settings>
08             <levels>
09               <level value="0" />
10               <level value="0.236" />
11               <level value="0.382" />
12               <level value="0.5" />
13               <level value="0.618" />
14               <level value="0.764" />
15               <level value="1" />
16               <level value="1.236" />
17               <level value="1.382" />
18               <level value="1.5" />
19               <level value="1.618" />
20               <level value="1.764" />
21               <level value="2.618" />
22               <level value="4.236" />
23             </levels>
24           </settings>
25         </fibonacci_retracement_annotation>
26       </annotation>
27     </annotation_list>
28   </annotations>
29 </stock>
01{
02  annotations: {
03    annotationList: [
04      {
05        id: "FRetracement_6918927152",
06        type: "FibonacciRetracement",
07        chart: "idMainChart",
08        axis: "primary",
09        allowEdit: true,
10        fibonacciRetracementAnnotation: {
11          color: "#DB2A0E",
12          firstTimeAnchor: "2009-03-30",
13          firstValueAnchor: 16.02,
14          secondTimeAnchor: "2009-05-07",
15          secondValueAnchor: 20.09,
16          settings: {
17            levels: [
18              {
19                value: 0
20              },
21              {
22                value: 0.236
23              },
24              {
25                value: 0.382
26              },
27              {
28                value: 0.5
29              },
30              {
31                value: 0.618
32              },
33              {
34                value: 0.764
35              },
36              {
37                value: 1
38              },
39              {
40                value: 1.236
41              },
42              {
43                value: 1.382
44              },
45              {
46                value: 1.5
47              },
48              {
49                value: 1.618
50              },
51              {
52                value: 1.764
53              },
54              {
55                value: 2.618
56              },
57              {
58                value: 4.236
59              }
60            ]
61          }
62        }
63      }
64    ]
65  }
66}

Note: in this snippet we show how to alter levels of a single annotation, but you can override defaults and change all annotations of a given type, learn about changing default in Annotations General Settings: Defaults.

Another important thing you should understand is the fact that level node can be used to configure visualization of a level: label, line and states settings, it can be done like that:

XML/JSON Syntax
Plain code
01 <?xml version="1.0" encoding="UTF-8"?>
02 <stock xmlns="http://anychart.com/products/stock/schemas/1.9.0/schema.xsd">
03   <annotations>
04     <annotation_list>
05       <annotation id="FRetracement_6918927152" type="FibonacciRetracement" chart="idMainChart" axis="primary" allow_edit="true">
06         <fibonacci_retracement_annotation color="#DB2A0E" first_time_anchor="2009-03-30" first_value_anchor="16.02" second_time_anchor="2009-05-07" second_value_anchor="20.09">
07           <settings>
08             <levels>
09               <level value="0">
10                 <line color="LightColor(#00FF00)" />
11                 <label>
12                   <font color="LightColor(#00FF00)" />
13                 </label>
14               </level>
15               <level value="0.236" />
16               <level value="0.382" />
17               <level value="0.5" />
18               <level value="0.618" />
19               <level value="0.764" />
20               <level value="1">
21                 <line color="#00FF00" />
22                 <label>
23                   <font color="#00FF00" />
24                 </label>
25               </level>
26               <level value="1.236" />
27               <level value="1.382" />
28               <level value="1.5" />
29               <level value="1.618" />
30               <level value="1.764" />
31               <level value="2.618" />
32               <level value="4.236">
33                 <line color="DarkColor(#00FF00)" />
34                 <label>
35                   <font color="DarkColor(#00FF00)" />
36                 </label>
37               </level>
38             </levels>
39           </settings>
40         </fibonacci_retracement_annotation>
41       </annotation>
42     </annotation_list>
43   </annotations>
44 </stock>
01{
02  annotations: {
03    annotationList: [
04      {
05        id: "FRetracement_6918927152",
06        type: "FibonacciRetracement",
07        chart: "idMainChart",
08        axis: "primary",
09        allowEdit: true,
10        fibonacciRetracementAnnotation: {
11          color: "#DB2A0E",
12          firstTimeAnchor: "2009-03-30",
13          firstValueAnchor: 16.02,
14          secondTimeAnchor: "2009-05-07",
15          secondValueAnchor: 20.09,
16          settings: {
17            levels: [
18              {
19                value: 0,
20                line: {
21                  color: "LightColor(#00FF00)"
22                },
23                label: {
24                  font: {
25                    color: "LightColor(#00FF00)"
26                  }
27                }
28              },
29              {
30                value: 0.236
31              },
32              {
33                value: 0.382
34              },
35              {
36                value: 0.5
37              },
38              {
39                value: 0.618
40              },
41              {
42                value: 0.764
43              },
44              {
45                value: 1,
46                line: {
47                  color: "#00FF00"
48                },
49                label: {
50                  font: {
51                    color: "#00FF00"
52                  }
53                }
54              },
55              {
56                value: 1.236
57              },
58              {
59                value: 1.382
60              },
61              {
62                value: 1.5
63              },
64              {
65                value: 1.618
66              },
67              {
68                value: 1.764
69              },
70              {
71                value: 2.618
72              },
73              {
74                value: 4.236,
75                line: {
76                  color: "DarkColor(#00FF00)"
77                },
78                label: {
79                  font: {
80                    color: "DarkColor(#00FF00)"
81                  }
82                }
83              }
84            ]
85          }
86        }
87      }
88    ]
89  }
90}

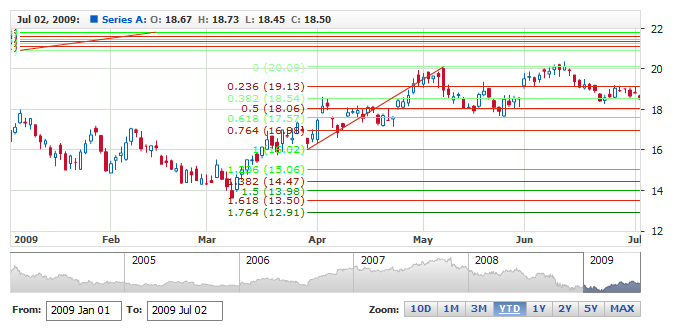
Take a look at the live sample where levels and visualization are changed in defaults section:

Live Sample:  Fibonacci Retracement Annotation - Levels Configuration in Defaults Section

Note: do not forget that only levels specified in <levels> node will be displayed, you can't change one level only - you should at least specify values for all other levels.

to top

Visual settings

You have a total control over the look of the Fibonacci Retracement, to define visual settings you need to add settings node and then use line node to set how it should look like. Sample XML/JSON snippet below shows this.

If you click on line node in the snippet, XML or JSON reference will be opened and you will be able to browse all possible settings, including the look of the line in different states.

XML/JSON Syntax
Plain code
01 <?xml version="1.0" encoding="UTF-8"?>
02 <stock xmlns="http://anychart.com/products/stock/schemas/1.9.0/schema.xsd">
03   <annotations>
04     <annotation_list>
05       <annotation id="FRetracement_0856719161" type="FibonacciRetracement" chart="idMainChart">
06         <fibonacci_retracement_annotation color="#000000" first_time_anchor="2009-03-30" first_value_anchor="16.02" second_time_anchor="2009-05-07" second_value_anchor="20.09">
07           <settings>
08             <line thickness="2" dashed="true" />
09           </settings>
10         </fibonacci_retracement_annotation>
11       </annotation>
12     </annotation_list>
13   </annotations>
14 </stock>
01{
02  annotations: {
03    annotationList: [
04      {
05        id: "FRetracement_0856719161",
06        type: "FibonacciRetracement",
07        chart: "idMainChart",
08        fibonacciRetracementAnnotation: {
09          color: "#000000",
10          firstTimeAnchor: "2009-03-30",
11          firstValueAnchor: 16.02,
12          secondTimeAnchor: "2009-05-07",
13          secondValueAnchor: 20.09,
14          settings: {
15            line: {
16              thickness: 2,
17              dashed: true
18            }
19          }
20        }
21      }
22    ]
23  }
24}

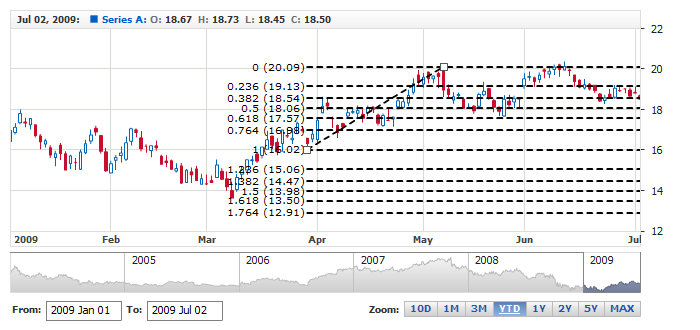
Live sample below contains Fibonacci Retracement Annotation colored and dashed, note that editing markers coloring is also modified here:

Live Sample:  Fibonacci Retracement Annotation - Visual Settings

to top

Labels

Since version 1.7 all Fibonacci annotations has labels and they are enabled by default, this section describes how you can disable them, configure text displayed and tune visualization.

Note: in this section we show how to alter settings of a single annotation, but you can override defaults and minimize the size of configs, learn about changing default in Annotations General Settings: Defaults.

to top

Enable/Disable

To disable labels for all levels in all states for a single annotation you need to set the following XML:

XML/JSON Syntax
Plain code
01 <?xml version="1.0" encoding="UTF-8"?>
02 <stock xmlns="http://anychart.com/products/stock/schemas/1.9.0/schema.xsd">
03   <annotations>
04     <annotation_list>
05       <annotation id="FRetracement_6918927152" type="FibonacciRetracement" chart="idMainChart" axis="primary" allow_edit="true">
06         <fibonacci_retracement_annotation color="#DB2A0E" first_time_anchor="2009-03-30" first_value_anchor="16.02" second_time_anchor="2009-05-07" second_value_anchor="20.09">
07           <settings>
08             <label enabled="false" />
09           </settings>
10         </fibonacci_retracement_annotation>
11       </annotation>
12     </annotation_list>
13   </annotations>
14 </stock>
01{
02  annotations: {
03    annotationList: [
04      {
05        id: "FRetracement_6918927152",
06        type: "FibonacciRetracement",
07        chart: "idMainChart",
08        axis: "primary",
09        allowEdit: true,
10        fibonacciRetracementAnnotation: {
11          color: "#DB2A0E",
12          firstTimeAnchor: "2009-03-30",
13          firstValueAnchor: 16.02,
14          secondTimeAnchor: "2009-05-07",
15          secondValueAnchor: 20.09,
16          settings: {
17            label: {
18              enabled: false
19            }
20          }
21        }
22      }
23    ]
24  }
25}

To disable label for one or several selected levels you need to use <levels> node and do enable/disable there, please note that all required levels should be specified, see Levels for clarification:

XML/JSON Syntax
Plain code
01 <?xml version="1.0" encoding="UTF-8"?>
02 <stock xmlns="http://anychart.com/products/stock/schemas/1.9.0/schema.xsd">
03   <annotations>
04     <annotation_list>
05       <annotation id="FRetracement_6918927152" type="FibonacciRetracement" chart="idMainChart" axis="primary" allow_edit="true">
06         <fibonacci_retracement_annotation color="#DB2A0E" first_time_anchor="2009-03-30" first_value_anchor="16.02" second_time_anchor="2009-05-07" second_value_anchor="20.09">
07           <settings>
08             <levels>
09               <level value="0">
10                 <label enabled="false" />
11               </level>
12               <level value="0.236" />
13               <level value="0.382" />
14               <level value="0.5" />
15               <level value="0.618" />
16               <level value="0.764" />
17               <level value="1" />
18               <level value="1.236" />
19               <level value="1.382" />
20               <level value="1.5" />
21               <level value="1.618" />
22               <level value="1.764">
23                 <label enabled="false" />
24               </level>
25               <level value="2.618" />
26               <level value="4.236" />
27             </levels>
28           </settings>
29         </fibonacci_retracement_annotation>
30       </annotation>
31     </annotation_list>
32   </annotations>
33 </stock>
01{
02  annotations: {
03    annotationList: [
04      {
05        id: "FRetracement_6918927152",
06        type: "FibonacciRetracement",
07        chart: "idMainChart",
08        axis: "primary",
09        allowEdit: true,
10        fibonacciRetracementAnnotation: {
11          color: "#DB2A0E",
12          firstTimeAnchor: "2009-03-30",
13          firstValueAnchor: 16.02,
14          secondTimeAnchor: "2009-05-07",
15          secondValueAnchor: 20.09,
16          settings: {
17            levels: [
18              {
19                value: 0,
20                label: {
21                  enabled: false
22                }
23              },
24              {
25                value: 0.236
26              },
27              {
28                value: 0.382
29              },
30              {
31                value: 0.5
32              },
33              {
34                value: 0.618
35              },
36              {
37                value: 0.764
38              },
39              {
40                value: 1
41              },
42              {
43                value: 1.236
44              },
45              {
46                value: 1.382
47              },
48              {
49                value: 1.5
50              },
51              {
52                value: 1.618
53              },
54              {
55                value: 1.764,
56                label: {
57                  enabled: false
58                }
59              },
60              {
61                value: 2.618
62              },
63              {
64                value: 4.236
65              }
66            ]
67          }
68        }
69      }
70    ]
71  }
72}

You can also make labels appear only in some states, for example when annotation is selected or hovered:

XML/JSON Syntax
Plain code
01 <?xml version="1.0" encoding="UTF-8"?>
02 <stock xmlns="http://anychart.com/products/stock/schemas/1.9.0/schema.xsd">
03   <annotations>
04     <annotation_list>
05       <annotation id="FRetracement_6918927152" type="FibonacciRetracement" chart="idMainChart" axis="primary" allow_edit="true">
06         <fibonacci_retracement_annotation color="#DB2A0E" first_time_anchor="2009-03-30" first_value_anchor="16.02" second_time_anchor="2009-05-07" second_value_anchor="20.09">
07           <settings>
08             <label enabled="false" />
09             <states>
10               <hover>
11                 <label enabled="true" />
12               </hover>
13               <selected>
14                 <label enabled="true" />
15               </selected>
16             </states>
17           </settings>
18         </fibonacci_retracement_annotation>
19       </annotation>
20     </annotation_list>
21   </annotations>
22 </stock>
01{
02  annotations: {
03    annotationList: [
04      {
05        id: "FRetracement_6918927152",
06        type: "FibonacciRetracement",
07        chart: "idMainChart",
08        axis: "primary",
09        allowEdit: true,
10        fibonacciRetracementAnnotation: {
11          color: "#DB2A0E",
12          firstTimeAnchor: "2009-03-30",
13          firstValueAnchor: 16.02,
14          secondTimeAnchor: "2009-05-07",
15          secondValueAnchor: 20.09,
16          settings: {
17            label: {
18              enabled: false
19            },
20            states: {
21              hover: {
22                label: {
23                  enabled: true
24                }
25              },
26              selected: {
27                label: {
28                  enabled: true
29                }
30              }
31            }
32          }
33        }
34      }
35    ]
36  }
37}

Here is a sample of a chart with two annotations, one without any labels, and another with labels that appear only if annotation is hovered or selected:

Live Sample:  Fibonacci Retracement Annotation - Enable and Disable Level Labels

to top

Format

You can define the text to be displayed in labels, you can either put static text in them or use tokens: {%LevelValue} — to display level value and/or {%Value} — to display value (price) corresponding to the level. Sample XML snippet shows basic formatting syntax:

XML/JSON Syntax
Plain code
01 <?xml version="1.0" encoding="UTF-8"?>
02 <stock xmlns="http://anychart.com/products/stock/schemas/1.9.0/schema.xsd">
03   <annotations>
04     <annotation_list>
05       <annotation id="FRetracement_6918927152" type="FibonacciRetracement" chart="idMainChart" axis="primary" allow_edit="true">
06         <fibonacci_retracement_annotation color="#000000" first_time_anchor="2009-03-30" first_value_anchor="13.02" second_time_anchor="2009-05-07" second_value_anchor="20.09">
07           <settings>
08             <label>
09               <format><![CDATA[{%LevelValue}{numDecimals:3,tralingZeros:true} ({%Value})]]></format>
10             </label>
11           </settings>
12         </fibonacci_retracement_annotation>
13       </annotation>
14     </annotation_list>
15   </annotations>
16 </stock>
01{
02  annotations: {
03    annotationList: [
04      {
05        id: "FRetracement_6918927152",
06        type: "FibonacciRetracement",
07        chart: "idMainChart",
08        axis: "primary",
09        allowEdit: true,
10        fibonacciRetracementAnnotation: {
11          color: "#000000",
12          firstTimeAnchor: "2009-03-30",
13          firstValueAnchor: 13.02,
14          secondTimeAnchor: "2009-05-07",
15          secondValueAnchor: 20.09,
16          settings: {
17            label: {
18              format: "{%LevelValue}{numDecimals:3,tralingZeros:true} ({%Value})"
19            }
20          }
21        }
22      }
23    ]
24  }
25}

As you can see, you can use common Number and Date Time formatting options. And, of course, you can use all Font configuration options.

See sample chart in the next section to see how formatting, font and visual settings work together.

to top

Visual Settings

Level labels, like any other label, has background with fill and border and font confuguration options, by default labels are formatted like this:

XML/JSON Syntax
Plain code
01 <settings>
02   <label anchor="RightCenter">
03     <background enabled="false">
04       <fill type="Gradient" opacity="0.8">
05         <gradient angle="90">
06           <keys>
07             <key color="#FEFEFE" />
08             <key color="#F1F1F1" />
09           </keys>
10         </gradient>
11       </fill>
12       <border color="#333333" opacity="0.3" />
13       <corners type="Rounded" all="4" />
14       <inside_margin all="2" />
15     </background>
16     <font family="Verdana" bold="false" size="10" align="Center" color="DarkColor(%Color)" render_as_html="false" />
17     <format><![CDATA[{%LevelValue}{numDecimals:3,trailingZeros:false} ({%Value})]]></format>
18   </label>
19 </settings>
01{
02  label: {
03    anchor: "RightCenter",
04    background: {
05      enabled: false,
06      fill: {
07        type: "Gradient",
08        opacity: 0.8,
09        gradient: {
10          angle: 90,
11          keys: [
12            {
13              color: "#FEFEFE"
14            },
15            {
16              color: "#F1F1F1"
17            }
18          ]
19        }
20      },
21      border: {
22        color: "#333333",
23        opacity: 0.3
24      },
25      corners: {
26        type: "Rounded",
27        all: 4
28      },
29      insideMargin: {
30        all: 2
31      }
32    },
33    font: {
34      family: "Verdana",
35      bold: false,
36      size: 10,
37      align: "Center",
38      color: "DarkColor(%Color)",
39      renderAsHtml: false
40    },
41    format: "{%LevelValue}{numDecimals:3,trailingZeros:false} ({%Value})"
42  }
43}

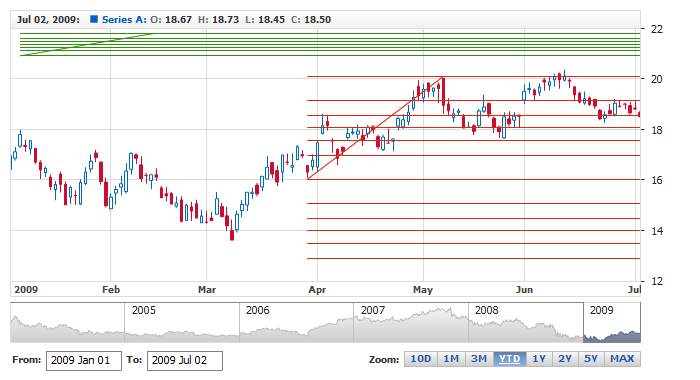
You can change these settings for any annotation or all of them, you can change the look of the label in some state, you can even change the labels behavior for the given levels. Please take a look at the sample below: defaults section and labels visual settings can completely change the look of annotations:

Live Sample:  Fibonacci Retracement Annotation - Levels Labels Visual Settings

to top