01 | { |
02 | settings: { |
03 | charts: [ |
04 | { |
05 | id: "idChart1" |
06 | }, |
07 | { |
08 | id: "idChart2" |
09 | }, |
10 | {} |
11 | ] |
12 | } |
13 | } |
General settings are the settings that can be done with any annotation regardless its type, this document also contains some other basic information you need to know about annotations: how to allow/forbid adding annotations, how to work with defaults and states.
![]()
There is one small prerequisite for config settings, if you want to add annotations: charts to which annotation should be added must have id attribute set. Take a look at XML/JSON snippet below:

As you can see there are three charts and only two of them have id set, so in this case you will be able to add annotations only the charts with ids set.
![]()
Annotations can be added to chart by user, you should use startDrawingAnnotation() method for that and learn about this option at: Working with Annotations tutorial.
If you want to add annotation to a chart in advance, for example load previously drawn annotations, you have to add appropriate XML/JSON settings into config.
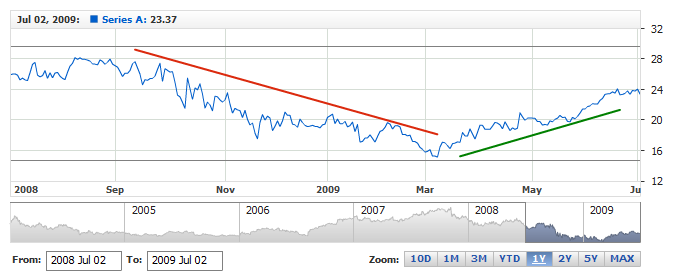
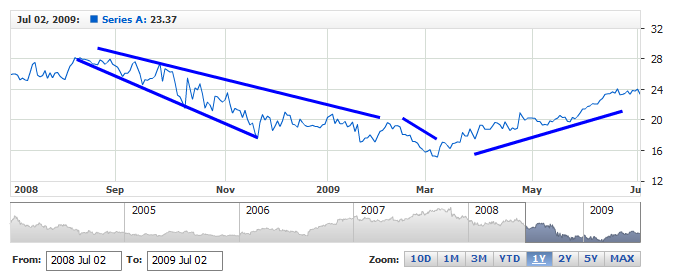
Sample XML/JSON snippet below shows how two different annotations can be added:
01 |
<?xml version="1.0" encoding="UTF-8"?> |
02 |
<stock xmlns="http://anychart.com/products/stock/schemas/1.9.0/schema.xsd"> |
03 |
<annotations> |
04 |
<annotation_list> |
05 |
<annotation id="idAnnotation1" type="HorizontalLine" chart="idMainChart"> |
06 |
<horizontal_line_annotation value_anchor="24.92" /> |
07 |
</annotation> |
08 |
<annotation id="idAnnotation2" type="Ellipse" chart="idMainChart"> |
09 |
<ellipse_annotation first_time_anchor="2009-02-15" first_value_anchor="24.82" second_time_anchor="2009-05-28" second_value_anchor="16.68" /> |
10 |
</annotation> |
11 |
</annotation_list> |
12 |
</annotations> |
13 |
</stock> |
01 | { |
02 | annotations: { |
03 | annotationList: [ |
04 | { |
05 | id: "idAnnotation1", |
06 | type: "HorizontalLine", |
07 | chart: "idMainChart", |
08 | horizontalLineAnnotation: { |
09 | valueAnchor: 24.92 |
10 | } |
11 | }, |
12 | { |
13 | id: "idAnnotation2", |
14 | type: "Ellipse", |
15 | chart: "idMainChart", |
16 | ellipseAnnotation: { |
17 | firstTimeAnchor: "2009-02-15", |
18 | firstValueAnchor: 24.82, |
19 | secondTimeAnchor: "2009-05-28", |
20 | secondValueAnchor: 16.68 |
21 | } |
22 | } |
23 | ] |
24 | } |
25 | } |
As you can see there is the annotation_list node, which contains as many annotation nodes as you need. There are three required attributes to add an annotation:
| Attribute | Description |
|---|---|
| id | Unique id of the annotation. |
| type | Annotation type, can be: AndrewsPitchfork Arrow Ellipse FibonacciFan FibonacciArc FibonacciRetracement FibonacciTimezones HorizontalLine InfiniteLine Label Line Ray Rectangle TrendChannel Triangle VerticalLine |
| chart | Id of the chart to which annotation should be added. |
![]()
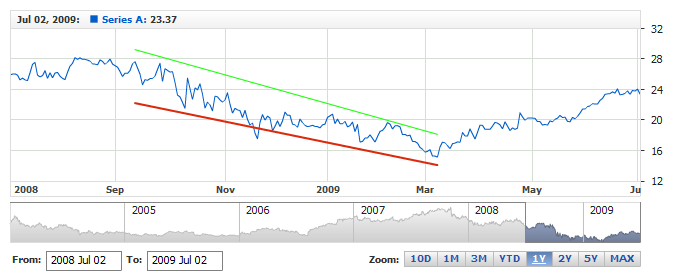
If you want to make annotation selection easier you can tune hit-test area, which can be set for each annotation separately. This area is controlled using hover_gap attribute, which is set in pixels. Snippet below shows how it can be configured for the Line annotation:
01 |
<annotation id="idLine1" type="Line" chart="idMainChart"> |
02 |
<line_annotation hover_gap="6" color="#DB2A0E" first_time_anchor="2008-09-12" first_value_anchor="29.20" second_time_anchor="2009-03-09" second_value_anchor="18.10" /> |
03 |
</annotation> |
01 | { |
02 | id: "idLine1", |
03 | type: "Line", |
04 | chart: "idMainChart", |
05 | lineAnnotation: { |
06 | hoverGap: 6, |
07 | color: "#DB2A0E", |
08 | firstTimeAnchor: "2008-09-12", |
09 | firstValueAnchor: 29.20, |
10 | secondTimeAnchor: "2009-03-09", |
11 | secondValueAnchor: 18.10 |
12 | } |
13 | } |
Illustration below explains what hover_gap controls: the bigger its value, the bigger the area of annotation selection is:
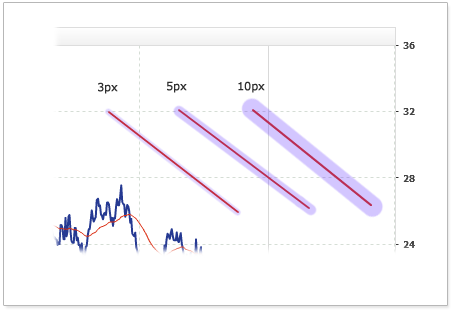
Live sample below contains three line annotations with different hover_gap settings:
![]()
When you have more than one value axis in the chart you may need to define axis binding not only for series, but for annotations too, because the annotations are placed according to value anchors.
To bind annotation to non-primary extra axis you have to specify axis id in axis attribute in annotation node, as shown below:
01 |
<annotation axis="yAxis1" id="idLine1" type="Line" chart="idMainChart"> |
02 |
<horizontal_line_annotation value_anchor="24.92" /> |
03 |
</annotation> |
01 | { |
02 | axis: "yAxis1", |
03 | id: "idLine1", |
04 | type: "Line", |
05 | chart: "idMainChart", |
06 | horizontalLineAnnotation: { |
07 | valueAnchor: 24.92 |
08 | } |
09 | } |
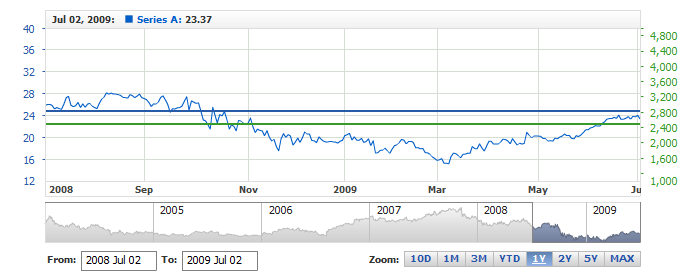
Live sample below contains two Horizontal Lines, one of them is bound to primary axis (shown on the left) and another is bound to extra Y axis (shown on the right):
01 |
<annotations> |
02 |
<annotation_list> |
03 |
<annotation id="idHorizontalLineAnnotation1" type="HorizontalLine" chart="idMainChart"> |
04 |
<horizontal_line_annotation value_anchor="24.92" color="#275BA8" /> |
05 |
</annotation> |
06 |
<annotation axis="extra_1" id="idHorizontalLineAnnotation2" type="HorizontalLine" chart="idMainChart"> |
07 |
<horizontal_line_annotation value_anchor="2492" color="#379B29" /> |
08 |
</annotation> |
09 |
</annotation_list> |
10 |
</annotations> |
01 | { |
02 | annotationList: [ |
03 | { |
04 | id: "idHorizontalLineAnnotation1", |
05 | type: "HorizontalLine", |
06 | chart: "idMainChart", |
07 | horizontalLineAnnotation: { |
08 | valueAnchor: 24.92, |
09 | color: "#275BA8" |
10 | } |
11 | }, |
12 | { |
13 | axis: "extra_1", |
14 | id: "idHorizontalLineAnnotation2", |
15 | type: "HorizontalLine", |
16 | chart: "idMainChart", |
17 | horizontalLineAnnotation: { |
18 | valueAnchor: 2492, |
19 | color: "#379B29" |
20 | } |
21 | } |
22 | ] |
23 | } |
So, although their value anchors are significantly different they are displayed close to each other:
![]()
You can use startDrawingAnnotation() method from AnyChart Stock JavaScript Library to give user an ability to add annotations via GUI. By default annotations can be added to any subchart shown, but you can forbid to add annotations to the selected chart using allow_adding_annotations attribute.
XML/JSON snippet below shows three charts and for two of them adding annotations is forbidden:
01 |
<?xml version="1.0" encoding="UTF-8"?> |
02 |
<stock xmlns="http://anychart.com/products/stock/schemas/1.9.0/schema.xsd"> |
03 |
<settings> |
04 |
<charts> |
05 |
<chart id="idChart1" allow_adding_annotations="true" /> |
06 |
<chart id="idChart2" allow_adding_annotations="false" /> |
07 |
<chart id="idChart3" allow_adding_annotations="false" /> |
08 |
</charts> |
09 |
</settings> |
10 |
</stock> |
01 | { |
02 | settings: { |
03 | charts: [ |
04 | { |
05 | id: "idChart1", |
06 | allowAddingAnnotations: true |
07 | }, |
08 | { |
09 | id: "idChart2", |
10 | allowAddingAnnotations: false |
11 | }, |
12 | { |
13 | id: "idChart3", |
14 | allowAddingAnnotations: false |
15 | } |
16 | ] |
17 | } |
18 | } |
![]()
By default any annotation, regardless to the way it has appeared on a chart, can be edited. You may want to forbid adding some annotations, for example those, which are set in XML/JSON and not drawn by user himself.
If you want to forbid editing and moving the annotation, you should set allow_edit attribute to "false". XML/JSON snippet below shows several annotations, which can not be edited:
01 |
<?xml version="1.0" encoding="UTF-8"?> |
02 |
<stock xmlns="http://anychart.com/products/stock/schemas/1.9.0/schema.xsd"> |
03 |
<annotations> |
04 |
<annotation_list> |
05 |
<annotation id="idAnnotation1" type="HorizontalLine" chart="idMainChart" allow_edit="false"> |
06 |
<horizontal_line_annotation value_anchor="24.92" /> |
07 |
</annotation> |
08 |
<annotation id="idAnnotation2" type="Ellipse" chart="idMainChart" allow_edit="false"> |
09 |
<ellipse_annotation first_time_anchor="2009-02-15" first_value_anchor="24.82" second_time_anchor="2009-05-28" second_value_anchor="16.68" /> |
10 |
</annotation> |
11 |
</annotation_list> |
12 |
</annotations> |
13 |
</stock> |
01 | { |
02 | annotations: { |
03 | annotationList: [ |
04 | { |
05 | id: "idAnnotation1", |
06 | type: "HorizontalLine", |
07 | chart: "idMainChart", |
08 | allowEdit: false, |
09 | horizontalLineAnnotation: { |
10 | valueAnchor: 24.92 |
11 | } |
12 | }, |
13 | { |
14 | id: "idAnnotation2", |
15 | type: "Ellipse", |
16 | chart: "idMainChart", |
17 | allowEdit: false, |
18 | ellipseAnnotation: { |
19 | firstTimeAnchor: "2009-02-15", |
20 | firstValueAnchor: 24.82, |
21 | secondTimeAnchor: "2009-05-28", |
22 | secondValueAnchor: 16.68 |
23 | } |
24 | } |
25 | ] |
26 | } |
27 | } |
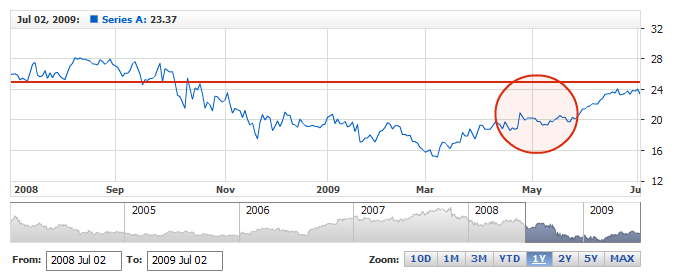
In the live sample below you can see how it works: annotations just reside on the chart and they can not be moved or resized.
![]()
Whenever you work with annotations you most likely need to change their color, we did all possible to make changing color easy. XML/JSON snippet below shows several annotations with changed color:
01 |
<?xml version="1.0" encoding="UTF-8"?> |
02 |
<stock xmlns="http://anychart.com/products/stock/schemas/1.9.0/schema.xsd"> |
03 |
<annotations> |
04 |
<annotation_list> |
05 |
<annotation id="idAnnotation1" type="HorizontalLine" chart="idMainChart"> |
06 |
<horizontal_line_annotation color="Red" value_anchor="24.92" /> |
07 |
</annotation> |
08 |
<annotation id="idAnnotation2" type="Ellipse" chart="idMainChart"> |
09 |
<ellipse_annotation color="Blue" first_time_anchor="2009-02-15" first_value_anchor="24.82" second_time_anchor="2009-05-28" second_value_anchor="16.68" /> |
10 |
</annotation> |
11 |
</annotation_list> |
12 |
</annotations> |
13 |
</stock> |
01 | { |
02 | annotations: { |
03 | annotationList: [ |
04 | { |
05 | id: "idAnnotation1", |
06 | type: "HorizontalLine", |
07 | chart: "idMainChart", |
08 | horizontalLineAnnotation: { |
09 | color: "Red", |
10 | valueAnchor: 24.92 |
11 | } |
12 | }, |
13 | { |
14 | id: "idAnnotation2", |
15 | type: "Ellipse", |
16 | chart: "idMainChart", |
17 | ellipseAnnotation: { |
18 | color: "Blue", |
19 | firstTimeAnchor: "2009-02-15", |
20 | firstValueAnchor: 24.82, |
21 | secondTimeAnchor: "2009-05-28", |
22 | secondValueAnchor: 16.68 |
23 | } |
24 | } |
25 | ] |
26 | } |
27 | } |
Live sample below shows changing color of four annotations:
%Color token
Above we have studied how to change color in a fastest way, with no regard to type and elements it consists of, but let's try to see how it works and do that with "Rectangle" annotation.
The color of rectangle is set in color attribute of <rectangle_annotation> node, but rectangle consists of fill and border which look different. So, how one color makes that?
XML/JSON snippet below shows a default template for this type of annotation:
01 |
<?xml version="1.0" encoding="UTF-8"?> |
02 |
<stock xmlns="http://anychart.com/products/stock/schemas/1.9.0/schema.xsd"> |
03 |
<annotations> |
04 |
<defaults> |
05 |
<rectangle_annotation color="#DB2A0E" hover_gap="5"> |
06 |
<settings> |
09 |
</settings> |
10 |
</rectangle_annotation> |
11 |
</defaults> |
12 |
</annotations> |
13 |
</stock> |
As you can see color for fill and border can be defined separately, but instead if that they both use %Color token. When the engine parses this %Color is replaced by the value set in color attribute. You may found this token useful if you'd like to create your own defaults.
![]()
All annotations can be interactive and, if you'd like to, you can tune annotation settings depending on user actions.
The following states can be tuned:
For any of these states you can tune visual settings. XML/JSON snippet below shows how Line annotation states can be tuned:
01 |
<?xml version="1.0" encoding="UTF-8"?> |
02 |
<stock xmlns="http://anychart.com/products/stock/schemas/1.9.0/schema.xsd"> |
03 |
<annotations> |
04 |
<annotation_list> |
05 |
<annotation id="idLine1" type="Line" chart="idMainChart"> |
06 |
<line_annotation color="#1EFF0E" first_time_anchor="2008-09-12" first_value_anchor="29.20" second_time_anchor="2009-03-09" second_value_anchor="18.10"> |
07 |
<settings> |
09 |
<states> |
10 |
<normal> |
12 |
</normal> |
13 |
<hover> |
15 |
</hover> |
16 |
<drawing> |
18 |
</drawing> |
19 |
<edit> |
20 |
<line color="#000000" thickness="2" dashed="true" dash_length="10" dash_space="10" /> |
21 |
</edit> |
22 |
<selected> |
23 |
<line thickness="2" dashed="true" dash_length="10" dash_space="10" /> |
24 |
</selected> |
25 |
</states> |
26 |
</settings> |
27 |
</line_annotation> |
28 |
</annotation> |
29 |
</annotation_list> |
30 |
</annotations> |
31 |
</stock> |
01 | { |
02 | annotations: { |
03 | annotationList: [ |
04 | { |
05 | id: "idLine1", |
06 | type: "Line", |
07 | chart: "idMainChart", |
08 | lineAnnotation: { |
09 | color: "#1EFF0E", |
10 | firstTimeAnchor: "2008-09-12", |
11 | firstValueAnchor: 29.20, |
12 | secondTimeAnchor: "2009-03-09", |
13 | secondValueAnchor: 18.10, |
14 | settings: { |
15 | line: { |
16 | color: "%Color" |
17 | }, |
18 | states: { |
19 | normal: { |
20 | line: { |
21 | thickness: 1 |
22 | } |
23 | }, |
24 | hover: { |
25 | line: { |
26 | thickness: 2, |
27 | opacity: 0.7 |
28 | } |
29 | }, |
30 | drawing: { |
31 | line: { |
32 | thickness: 1, |
33 | opacity: 0.8 |
34 | } |
35 | }, |
36 | edit: { |
37 | line: { |
38 | color: "#000000", |
39 | thickness: 2, |
40 | dashed: true, |
41 | dashLength: 10, |
42 | dashSpace: 10 |
43 | } |
44 | }, |
45 | selected: { |
46 | line: { |
47 | thickness: 2, |
48 | dashed: true, |
49 | dashLength: 10, |
50 | dashSpace: 10 |
51 | } |
52 | } |
53 | } |
54 | } |
55 | } |
56 | } |
57 | ] |
58 | } |
59 | } |
Live sample below shows how it works with Line annotation. Try to hover, select or edit it and you will see: one of the lines is tuned and another behaves by default:
![]()
Annotation can be added to a chart using XML/JSON config and when any annotation is added to the plot you need to set timestamps, which define where they should be placed to. And, as well as you may need to set time offset for data or event markers, you may need time offset for annotations.
Setting time offset for data and markers is described at:
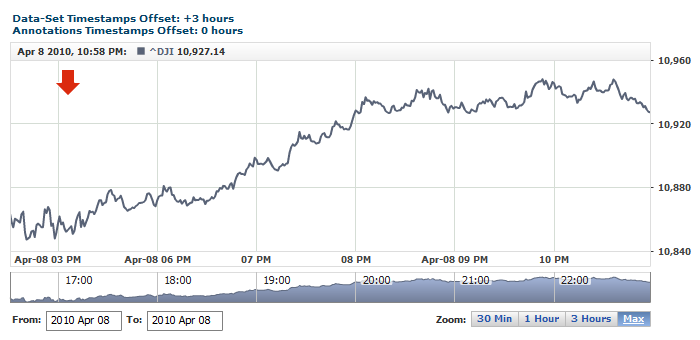
To set time offset for annotations you need to define it in time_offset attribute, which can be either positive or negative and is set in hours (it may be also a fractional number).
Sample XML/JSON snippet shows +5 hours offset settings:
01 |
<?xml version="1.0" encoding="UTF-8"?> |
02 |
<stock xmlns="http://anychart.com/products/stock/schemas/1.9.0/schema.xsd"> |
03 |
<annotations time_offset="5"> |
04 |
<annotation_list> |
05 |
<annotation id="idArrowAnnotation1" type="Arrow" chart="idMainChart" allow_edit="false"> |
06 |
<arrow_annotation time_anchor="2010-04-08 17:06" value_anchor="10937.67" direction="Down" width="26" length="26" /> |
07 |
</annotation> |
08 |
</annotation_list> |
09 |
</annotations> |
10 |
</stock> |
01 | { |
02 | annotations: { |
03 | timeOffset: 5, |
04 | annotationList: [ |
05 | { |
06 | id: "idArrowAnnotation1", |
07 | type: "Arrow", |
08 | chart: "idMainChart", |
09 | allowEdit: false, |
10 | arrowAnnotation: { |
11 | timeAnchor: "2010-04-08 17:06", |
12 | valueAnchor: 10937.67, |
13 | direction: "Down", |
14 | width: 26, |
15 | length: 26 |
16 | } |
17 | } |
18 | ] |
19 | } |
20 | } |
Live sample below shows the situation when data set has the offset set and annotations - have not:
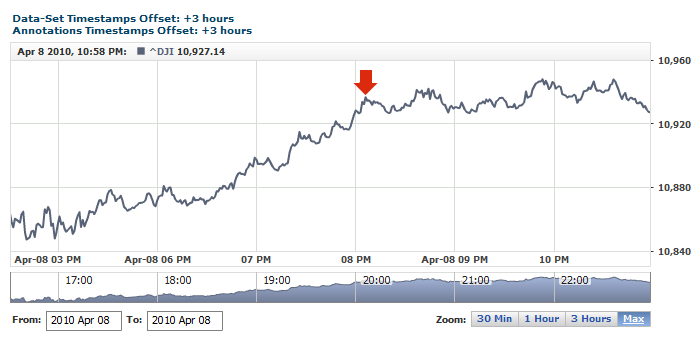
To synch data and annotations you have to set the same time offsets both for data and annotations, as in the next sample:
![]()
AnyChart Stock team does its best to provide the best settings for all element, including annotations. But if you are not satisfied you can alter the defaults using <defaults> node. You can enter your own defaults and they will be applied whenever you add a new annotation.
XML/JSON snippet below shows how to set defaults for "Line" annotation:
01 |
<?xml version="1.0" encoding="UTF-8"?> |
02 |
<stock xmlns="http://anychart.com/products/stock/schemas/1.9.0/schema.xsd"> |
03 |
<annotations> |
04 |
<defaults> |
05 |
<line_annotation color="Blue" hover_gap="3"> |
06 |
<settings> |
08 |
</settings> |
09 |
</line_annotation> |
10 |
</defaults> |
11 |
</annotations> |
12 |
</stock> |
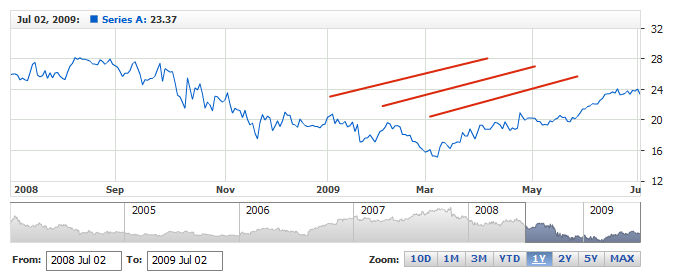
Live sample below shows altering defaults in action. Colors and style for Line annotations is set in defaults sections, and five line annotations is added:
If you'd like to see what are the defaults for annotations (or any other element) you can do that in AnyChart Stock: Default Settings Template.
![]()