Fibonacci Fan Annotation

Overview

Fibonacci Fan is a Fibonacci retracement tool that takes both price and time into consideration. Comparing to horizontal Fibonacci lines it offers an additional feature — price movement projection far further in time.

Fibonacci Fan annotation allows to add this type of drawing to the chart, as any other annotation it can be drawn by user or added to the chart via XML or JSON settings. In this article you can learn how to add it via XML or JSON settings and what visual settings can be done.

To learn about basic settings, that can be done with an annotation please refer to: Drawing Tools and Annotations: General Settings.

to top

Adding annotation via settings

To add a Fibonacci Fan annotation to a chart you need to, as with any other annotation, add an annotation node, assign the id, set "FibonacciFan" type and specify the chart id using chart attribute.

In fibonacci_fan_annotation node you need specify value and time anchors, which define two points needed to draw this type of annotation.

All this you can see in the basic XML/JSON snippet below:

XML/JSON Syntax
Plain code
01 <?xml version="1.0" encoding="UTF-8"?>
02 <stock xmlns="http://anychart.com/products/stock/schemas/1.9.0/schema.xsd">
03   <annotations>
04     <annotation_list>
05       <annotation id="FFan_0856719161" type="FibonacciFan" chart="idMainChart">
06         <fibonacci_fan_annotation color="#DB2A0E" first_time_anchor="2009-03-30" first_value_anchor="16.02" second_time_anchor="2009-05-07" second_value_anchor="20.09" />
07       </annotation>
08     </annotation_list>
09   </annotations>
10 </stock>
01{
02  annotations: {
03    annotationList: [
04      {
05        id: "FFan_0856719161",
06        type: "FibonacciFan",
07        chart: "idMainChart",
08        fibonacciFanAnnotation: {
09          color: "#DB2A0E",
10          firstTimeAnchor: "2009-03-30",
11          firstValueAnchor: 16.02,
12          secondTimeAnchor: "2009-05-07",
13          secondValueAnchor: 20.09
14        }
15      }
16    ]
17  }
18}

Live sample below shows a chart with this sample basic Fibonacci Fan annotation:

Live Sample:  Adding Fibonacci Fan Annotation
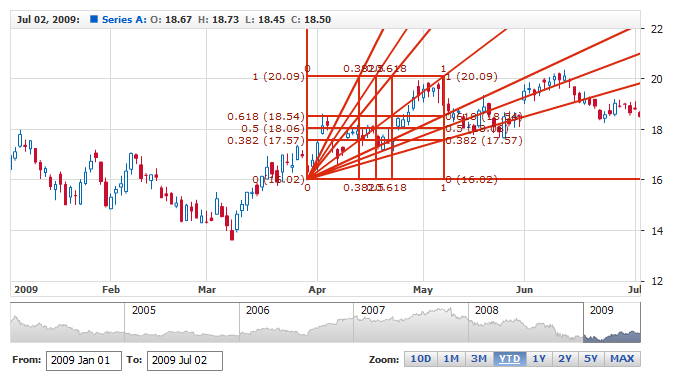
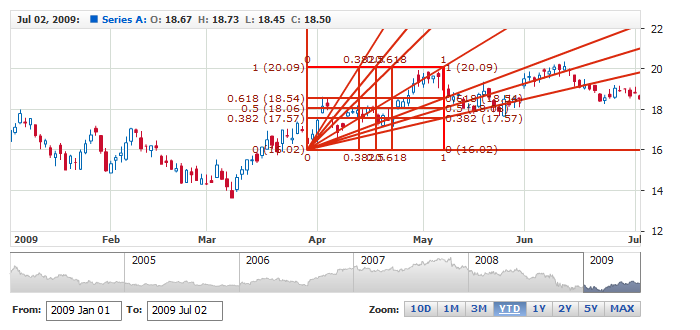
to top

Levels

Version 1.7 introduces new, improved, Fibonacci Fan: with configurable number of Price Levels and Time Levels.

You have an option to choose what levels are displayed and even specify the ratio of levels. It is done in <levels> node, like shown in the snippet below. Please note, that this snippet also shows default levels and ratios: you can define any number of levels and set any ratio in value attribute, even if these values do not match Fibonacci sequence.

XML/JSON Syntax
Plain code
01 <?xml version="1.0" encoding="UTF-8"?>
02 <stock xmlns="http://anychart.com/products/stock/schemas/1.9.0/schema.xsd">
03   <annotations>
04     <annotation_list>
05       <annotation id="FFan_0856719161" type="FibonacciFan" chart="idMainChart">
06         <fibonacci_fan_annotation color="#000000" first_time_anchor="2009-03-30" first_value_anchor="16.02" second_time_anchor="2009-05-07" second_value_anchor="20.09">
07           <settings>
08             <price_levels>
09               <price_level value="0" />
10               <price_level value="0.382" />
11               <price_level value="0.5" />
12               <price_level value="0.618" />
13               <price_level value="1" />
14             </price_levels>
15             <time_levels>
16               <time_level value="0" />
17               <time_level value="0.382" />
18               <time_level value="0.5" />
19               <time_level value="0.618" />
20               <time_level value="1" />
21             </time_levels>
22           </settings>
23         </fibonacci_fan_annotation>
24       </annotation>
25     </annotation_list>
26   </annotations>
27 </stock>
01{
02  annotations: {
03    annotationList: [
04      {
05        id: "FFan_0856719161",
06        type: "FibonacciFan",
07        chart: "idMainChart",
08        fibonacciFanAnnotation: {
09          color: "#000000",
10          firstTimeAnchor: "2009-03-30",
11          firstValueAnchor: 16.02,
12          secondTimeAnchor: "2009-05-07",
13          secondValueAnchor: 20.09,
14          settings: {
15            priceLevels: [
16              {
17                value: 0
18              },
19              {
20                value: 0.382
21              },
22              {
23                value: 0.5
24              },
25              {
26                value: 0.618
27              },
28              {
29                value: 1
30              }
31            ],
32            timeLevels: [
33              {
34                value: 0
35              },
36              {
37                value: 0.382
38              },
39              {
40                value: 0.5
41              },
42              {
43                value: 0.618
44              },
45              {
46                value: 1
47              }
48            ]
49          }
50        }
51      }
52    ]
53  }
54}

Note: in this snippet we show how to alter levels of a single annotation, but you can override defaults and change all annotations of a given type, learn about changing default in Annotations General Settings: Defaults.

Another important thing you should understand is the fact that level node can be used to configure visualization of a level: label, line and states settings, it can be done like that:

XML/JSON Syntax
Plain code
01 <?xml version="1.0" encoding="UTF-8"?>
02 <stock xmlns="http://anychart.com/products/stock/schemas/1.9.0/schema.xsd">
03   <annotations>
04     <annotation_list>
05       <annotation id="FFan_0856719161" type="FibonacciFan" chart="idMainChart">
06         <fibonacci_fan_annotation color="#000000" first_time_anchor="2009-03-30" first_value_anchor="16.02" second_time_anchor="2009-05-07" second_value_anchor="20.09">
07           <settings>
08             <price_levels>
09               <price_level value="0">
10                 <grid_line color="Red" />
11               </price_level>
12               <price_level value="0.382" />
13               <price_level value="0.5" />
14               <price_level value="0.618" />
15               <price_level value="1">
16                 <grid_line color="Red" />
17               </price_level>
18             </price_levels>
19             <time_levels>
20               <time_level value="0">
21                 <grid_line color="Red" />
22               </time_level>
23               <time_level value="0.382" />
24               <time_level value="0.5" />
25               <time_level value="0.618" />
26               <time_level value="1">
27                 <grid_line color="Red" />
28               </time_level>
29             </time_levels>
30           </settings>
31         </fibonacci_fan_annotation>
32       </annotation>
33     </annotation_list>
34   </annotations>
35 </stock>
01{
02  annotations: {
03    annotationList: [
04      {
05        id: "FFan_0856719161",
06        type: "FibonacciFan",
07        chart: "idMainChart",
08        fibonacciFanAnnotation: {
09          color: "#000000",
10          firstTimeAnchor: "2009-03-30",
11          firstValueAnchor: 16.02,
12          secondTimeAnchor: "2009-05-07",
13          secondValueAnchor: 20.09,
14          settings: {
15            priceLevels: [
16              {
17                value: 0,
18                gridLine: {
19                  color: "Red"
20                }
21              },
22              {
23                value: 0.382
24              },
25              {
26                value: 0.5
27              },
28              {
29                value: 0.618
30              },
31              {
32                value: 1,
33                gridLine: {
34                  color: "Red"
35                }
36              }
37            ],
38            timeLevels: [
39              {
40                value: 0,
41                gridLine: {
42                  color: "Red"
43                }
44              },
45              {
46                value: 0.382
47              },
48              {
49                value: 0.5
50              },
51              {
52                value: 0.618
53              },
54              {
55                value: 1,
56                gridLine: {
57                  color: "Red"
58                }
59              }
60            ]
61          }
62        }
63      }
64    ]
65  }
66}

Take a look at the live sample where levels and visualization are changed in defaults section:

Live Sample:  Fibonacci Fan Annotation -Levels Configuration in Defaults Section

Note: do not forget that only levels specified in <levels> node will be displayed, you can't change one level only - you should at least specify values for all other levels.

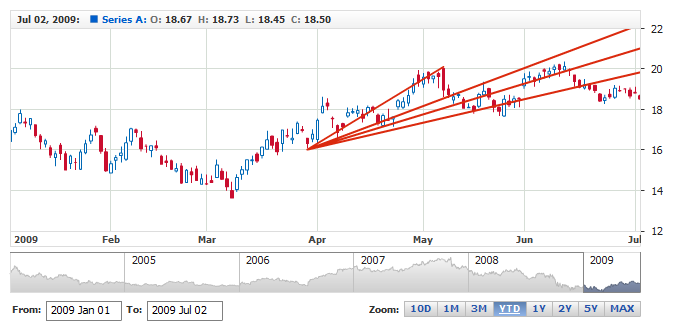
Please also take a look at the settings and sample that show how defaults should be modified to revert Fibonacci Fan to the state it was in versions 1.6.1 and earlier:

XML/JSON Syntax
Plain code
01 <?xml version="1.0" encoding="UTF-8"?>
02 <stock xmlns="http://anychart.com/products/stock/schemas/1.9.0/schema.xsd">
03   <annotations>
04     <annotation_list>
05       <annotation id="FFan_0856719161" type="FibonacciFan" chart="idMainChart">
06         <fibonacci_fan_annotation color="#000000" first_time_anchor="2009-03-30" first_value_anchor="16.02" second_time_anchor="2009-05-07" second_value_anchor="20.09">
07           <settings>
08             <time_level_line enabled="false" />
09             <time_level_grid_line enabled="false" />
10             <price_level_grid_line enabled="false" />
11             <time_level_near_label enabled="false" />
12             <time_level_far_label enabled="false" />
13             <price_level_near_label enabled="false" />
14             <price_level_far_label enabled="false" />
15             <price_levels>
16               <price_level value="0.382" />
17               <price_level value="0.5" />
18               <price_level value="0.618" />
19             </price_levels>
20           </settings>
21         </fibonacci_fan_annotation>
22       </annotation>
23     </annotation_list>
24   </annotations>
25 </stock>
01{
02  annotations: {
03    annotationList: [
04      {
05        id: "FFan_0856719161",
06        type: "FibonacciFan",
07        chart: "idMainChart",
08        fibonacciFanAnnotation: {
09          color: "#000000",
10          firstTimeAnchor: "2009-03-30",
11          firstValueAnchor: 16.02,
12          secondTimeAnchor: "2009-05-07",
13          secondValueAnchor: 20.09,
14          settings: {
15            timeLevelLine: {
16              enabled: false
17            },
18            timeLevelGridLine: {
19              enabled: false
20            },
21            priceLevelGridLine: {
22              enabled: false
23            },
24            timeLevelNearLabel: {
25              enabled: false
26            },
27            timeLevelFarLabel: {
28              enabled: false
29            },
30            priceLevelNearLabel: {
31              enabled: false
32            },
33            priceLevelFarLabel: {
34              enabled: false
35            },
36            priceLevels: [
37              {
38                value: 0.382
39              },
40              {
41                value: 0.5
42              },
43              {
44                value: 0.618
45              }
46            ]
47          }
48        }
49      }
50    ]
51  }
52}

And here is a live sample with such settings put into defaults section:

Live Sample:  Fibonacci Fan Annotation - Levels Configuration in Defaults Section Pre 1.7 Versions Compatibility

to top

Visual settings

You have a total control over the look of the Fibonacci Fan, to define visual settings you need to add settings node and then use line node to set how it should look like. Sample XML/JSON snippet below shows this.

If you click on line node in the snippet, XML or JSON reference will be opened and you will be able to browse all possible settings, including the look of the line in different states.

XML/JSON Syntax
Plain code
01 <?xml version="1.0" encoding="UTF-8"?>
02 <stock xmlns="http://anychart.com/products/stock/schemas/1.9.0/schema.xsd">
03   <annotations>
04     <annotation_list>
05       <annotation id="FFan_0856719161" type="FibonacciFan" chart="idMainChart">
06         <fibonacci_fan_annotation color="#000000" first_time_anchor="2009-03-30" first_value_anchor="16.02" second_time_anchor="2009-05-07" second_value_anchor="20.09">
07           <settings>
08             <line thickness="2" dashed="true" />
09           </settings>
10         </fibonacci_fan_annotation>
11       </annotation>
12     </annotation_list>
13   </annotations>
14 </stock>
01{
02  annotations: {
03    annotationList: [
04      {
05        id: "FFan_0856719161",
06        type: "FibonacciFan",
07        chart: "idMainChart",
08        fibonacciFanAnnotation: {
09          color: "#000000",
10          firstTimeAnchor: "2009-03-30",
11          firstValueAnchor: 16.02,
12          secondTimeAnchor: "2009-05-07",
13          secondValueAnchor: 20.09,
14          settings: {
15            line: {
16              thickness: 2,
17              dashed: true
18            }
19          }
20        }
21      }
22    ]
23  }
24}

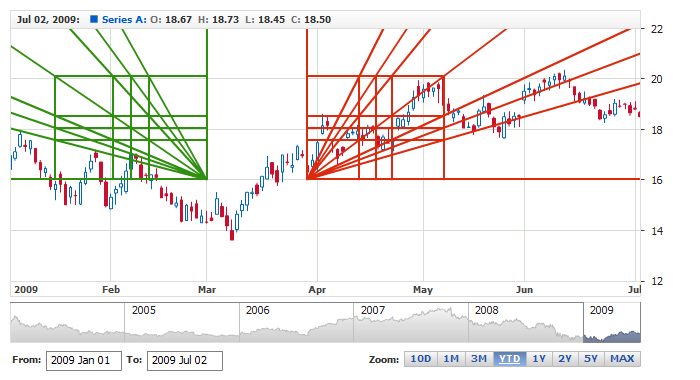
Version 1.7 introduces more complex Fibonacci Fan: with Price lines, Time lines, Grid and separate settings for Trend line. Whilst the settings above still work and, if set, are applied to all lines at once, you can also configure all lines separately with access to states and all the stuff, that is available:

XML/JSON Syntax
Plain code
01 <?xml version="1.0" encoding="UTF-8"?>
02 <stock xmlns="http://anychart.com/products/stock/schemas/1.9.0/schema.xsd">
03   <annotations>
04     <annotation_list>
05       <annotation id="FFan_0856719161" type="FibonacciFan" chart="idMainChart">
06         <fibonacci_fan_annotation color="#000000" first_time_anchor="2009-03-30" first_value_anchor="16.02" second_time_anchor="2009-05-07" second_value_anchor="20.09">
07           <settings>
08             <line dashed="true" />
09             <trend_line color="Red" />
10             <grid_line thickness="1" />
11             <price_level_grid_line color="Black" />
12             <time_level_grid_line enabled="false" />
13             <price_level_line color="LightColor(Red)" />
14             <time_level_line color="LightColor(Green)" />
15           </settings>
16         </fibonacci_fan_annotation>
17       </annotation>
18     </annotation_list>
19   </annotations>
20 </stock>
01{
02  annotations: {
03    annotationList: [
04      {
05        id: "FFan_0856719161",
06        type: "FibonacciFan",
07        chart: "idMainChart",
08        fibonacciFanAnnotation: {
09          color: "#000000",
10          firstTimeAnchor: "2009-03-30",
11          firstValueAnchor: 16.02,
12          secondTimeAnchor: "2009-05-07",
13          secondValueAnchor: 20.09,
14          settings: {
15            line: {
16              dashed: true
17            },
18            trendLine: {
19              color: "Red"
20            },
21            gridLine: {
22              thickness: 1
23            },
24            priceLevelGridLine: {
25              color: "Black"
26            },
27            timeLevelGridLine: {
28              enabled: false
29            },
30            priceLevelLine: {
31              color: "LightColor(Red)"
32            },
33            timeLevelLine: {
34              color: "LightColor(Green)"
35            }
36          }
37        }
38      }
39    ]
40  }
41}

Note: all lines (<trend_line>, <grid_line>, <price_level_grid_line>, <time_level_grid_line>, <price_level_line>, <time_level_line>) inherit settings specified in <line> node; <price_level_grid_line> and <time_level_grid_line> inherit setting from <grid_line>.

Thus: be careful with this inheritance, it can be used to minimize and simplify settings, but you should understand how settings depend on each other.

Live sample below contains Fibonacci Fan Annotation colored, note that editing markers coloring is also modified here:

Live Sample:  Fibonacci Fan Annotation - Visual Settings

to top

Labels

Since version 1.7 all Fibonacci annotations has labels and they are enabled by default, this section describes how you can disable them, configure text displayed and tune visualization.

Note: in this section we show how to alter settings of a single annotation, but you can override defaults and minimize the size of configs, learn about changing default in Annotations General Settings: Defaults.

to top

Enable/Disable

Unlike other Fibonacci tools, Fan has four sets of labels and you can turn them all on and off separately: Price levels labels (near and far) and Time levels labels (near and far).

To disable labels for all levels in all states for a single annotation you need to set the following XML:

XML/JSON Syntax
Plain code
01 <?xml version="1.0" encoding="UTF-8"?>
02 <stock xmlns="http://anychart.com/products/stock/schemas/1.9.0/schema.xsd">
03   <annotations>
04     <annotation_list>
05       <annotation id="FFan_6918927152" type="FibonacciFan" chart="idMainChart" axis="primary" allow_edit="true">
06         <fibonacci_fan_annotation color="#DB2A0E" first_time_anchor="2009-03-30" first_value_anchor="16.02" second_time_anchor="2009-05-07" second_value_anchor="20.09">
07           <settings>
08             <time_level_near_label enabled="false" />
09             <time_level_far_label enabled="false" />
10             <price_level_near_label enabled="false" />
11             <price_level_far_label enabled="false" />
12           </settings>
13         </fibonacci_fan_annotation>
14       </annotation>
15     </annotation_list>
16   </annotations>
17 </stock>
01{
02  annotations: {
03    annotationList: [
04      {
05        id: "FFan_6918927152",
06        type: "FibonacciFan",
07        chart: "idMainChart",
08        axis: "primary",
09        allowEdit: true,
10        fibonacciFanAnnotation: {
11          color: "#DB2A0E",
12          firstTimeAnchor: "2009-03-30",
13          firstValueAnchor: 16.02,
14          secondTimeAnchor: "2009-05-07",
15          secondValueAnchor: 20.09,
16          settings: {
17            timeLevelNearLabel: {
18              enabled: false
19            },
20            timeLevelFarLabel: {
21              enabled: false
22            },
23            priceLevelNearLabel: {
24              enabled: false
25            },
26            priceLevelFarLabel: {
27              enabled: false
28            }
29          }
30        }
31      }
32    ]
33  }
34}

To disable label for one or several selected levels you need to use <levels> node and do enable/disable there, please note that all required levels should be specified, see Levels for clarification:

XML/JSON Syntax
Plain code
01 <?xml version="1.0" encoding="UTF-8"?>
02 <stock xmlns="http://anychart.com/products/stock/schemas/1.9.0/schema.xsd">
03   <annotations>
04     <annotation_list>
05       <annotation id="FFan_6918927152" type="FibonacciFan" chart="idMainChart" axis="primary" allow_edit="true">
06         <fibonacci_fan_annotation color="#DB2A0E" first_time_anchor="2009-03-30" first_value_anchor="16.02" second_time_anchor="2009-05-07" second_value_anchor="20.09">
07           <settings>
08             <price_levels>
09               <price_level value="0">
10                 <near_label enabled="false" />
11                 <far_label enabled="false" />
12               </price_level>
13               <price_level value="0.382" />
14               <price_level value="0.5" />
15               <price_level value="0.618" />
16               <price_level value="1">
17                 <near_label enabled="false" />
18                 <far_label enabled="false" />
19               </price_level>
20             </price_levels>
21             <time_levels>
22               <time_level value="0">
23                 <near_label enabled="false" />
24                 <far_label enabled="false" />
25               </time_level>
26               <time_level value="0.382" />
27               <time_level value="0.5" />
28               <time_level value="0.618" />
29               <time_level value="1">
30                 <near_label enabled="false" />
31                 <far_label enabled="false" />
32               </time_level>
33             </time_levels>
34           </settings>
35         </fibonacci_fan_annotation>
36       </annotation>
37     </annotation_list>
38   </annotations>
39 </stock>
01{
02  annotations: {
03    annotationList: [
04      {
05        id: "FFan_6918927152",
06        type: "FibonacciFan",
07        chart: "idMainChart",
08        axis: "primary",
09        allowEdit: true,
10        fibonacciFanAnnotation: {
11          color: "#DB2A0E",
12          firstTimeAnchor: "2009-03-30",
13          firstValueAnchor: 16.02,
14          secondTimeAnchor: "2009-05-07",
15          secondValueAnchor: 20.09,
16          settings: {
17            priceLevels: [
18              {
19                value: 0,
20                nearLabel: {
21                  enabled: false
22                },
23                farLabel: {
24                  enabled: false
25                }
26              },
27              {
28                value: 0.382
29              },
30              {
31                value: 0.5
32              },
33              {
34                value: 0.618
35              },
36              {
37                value: 1,
38                nearLabel: {
39                  enabled: false
40                },
41                farLabel: {
42                  enabled: false
43                }
44              }
45            ],
46            timeLevels: [
47              {
48                value: 0,
49                nearLabel: {
50                  enabled: false
51                },
52                farLabel: {
53                  enabled: false
54                }
55              },
56              {
57                value: 0.382
58              },
59              {
60                value: 0.5
61              },
62              {
63                value: 0.618
64              },
65              {
66                value: 1,
67                nearLabel: {
68                  enabled: false
69                },
70                farLabel: {
71                  enabled: false
72                }
73              }
74            ]
75          }
76        }
77      }
78    ]
79  }
80}

You can also make labels appear only in some states, for example when annotation is selected or hovered:

XML/JSON Syntax
Plain code
01 <?xml version="1.0" encoding="UTF-8"?>
02 <stock xmlns="http://anychart.com/products/stock/schemas/1.9.0/schema.xsd">
03   <annotations>
04     <annotation_list>
05       <annotation id="FFan_6918927152" type="FibonacciFan" chart="idMainChart" axis="primary" allow_edit="true">
06         <fibonacci_fan_annotation color="#DB2A0E" first_time_anchor="2009-03-30" first_value_anchor="16.02" second_time_anchor="2009-05-07" second_value_anchor="20.09">
07           <settings>
08             <time_level_near_label enabled="false" />
09             <time_level_far_label enabled="false" />
10             <price_level_near_label enabled="false" />
11             <price_level_far_label enabled="false" />
12             <states>
13               <hover>
14                 <time_level_near_label enabled="true" />
15                 <time_level_far_label enabled="true" />
16                 <price_level_near_label enabled="true" />
17                 <price_level_far_label enabled="true" />
18               </hover>
19             </states>
20           </settings>
21         </fibonacci_fan_annotation>
22       </annotation>
23     </annotation_list>
24   </annotations>
25 </stock>
01{
02  annotations: {
03    annotationList: [
04      {
05        id: "FFan_6918927152",
06        type: "FibonacciFan",
07        chart: "idMainChart",
08        axis: "primary",
09        allowEdit: true,
10        fibonacciFanAnnotation: {
11          color: "#DB2A0E",
12          firstTimeAnchor: "2009-03-30",
13          firstValueAnchor: 16.02,
14          secondTimeAnchor: "2009-05-07",
15          secondValueAnchor: 20.09,
16          settings: {
17            timeLevelNearLabel: {
18              enabled: false
19            },
20            timeLevelFarLabel: {
21              enabled: false
22            },
23            priceLevelNearLabel: {
24              enabled: false
25            },
26            priceLevelFarLabel: {
27              enabled: false
28            },
29            states: {
30              hover: {
31                timeLevelNearLabel: {
32                  enabled: true
33                },
34                timeLevelFarLabel: {
35                  enabled: true
36                },
37                priceLevelNearLabel: {
38                  enabled: true
39                },
40                priceLevelFarLabel: {
41                  enabled: true
42                }
43              }
44            }
45          }
46        }
47      }
48    ]
49  }
50}

Here is a sample of a chart with two annotations, one without any labels, and another with labels that appear only if annotation is hovered or selected:

Live Sample:  Fibonacci Fan Annotation - Enable and Disable Level Labels

to top

Format

You can define the text to be displayed in labels, you can either put static text in them or use tokens: {%LevelValue} — to display level values and/or {%Value} and {%Date} — to display value (price) and timestamp corresponding to the level. Sample XML snippet shows basic formatting syntax:

XML/JSON Syntax
Plain code
01 <?xml version="1.0" encoding="UTF-8"?>
02 <stock xmlns="http://anychart.com/products/stock/schemas/1.9.0/schema.xsd">
03   <annotations>
04     <annotation_list>
05       <annotation id="FFan_6918927154" type="FibonacciFan" chart="idMainChart" axis="primary" allow_edit="true">
06         <fibonacci_fan_annotation color="#2F8F0E" second_time_anchor="2009-01-15" first_value_anchor="16.02" first_time_anchor="2009-03-02" second_value_anchor="20.09">
07           <settings>
08             <time_level_near_label>
09               <format><![CDATA[{%LevelValue}{numDecimals:3,trailingZeros:false}]]></format>
10             </time_level_near_label>
11             <time_level_far_label>
12               <format><![CDATA[{%Date}{"%dd %MMM"}]]></format>
13             </time_level_far_label>
14             <price_level_near_label>
15               <format><![CDATA[{%LevelValue}{numDecimals:3,trailingZeros:false}]]></format>
16             </price_level_near_label>
17             <price_level_far_label>
18               <format><![CDATA[{%Value}]]></format>
19             </price_level_far_label>
20           </settings>
21         </fibonacci_fan_annotation>
22       </annotation>
23     </annotation_list>
24   </annotations>
25 </stock>
01{
02  annotations: {
03    annotationList: [
04      {
05        id: "FFan_6918927154",
06        type: "FibonacciFan",
07        chart: "idMainChart",
08        axis: "primary",
09        allowEdit: true,
10        fibonacciFanAnnotation: {
11          color: "#2F8F0E",
12          secondTimeAnchor: "2009-01-15",
13          firstValueAnchor: 16.02,
14          firstTimeAnchor: "2009-03-02",
15          secondValueAnchor: 20.09,
16          settings: {
17            timeLevelNearLabel: {
18              format: "{%LevelValue}{numDecimals:3,trailingZeros:false}"
19            },
20            timeLevelFarLabel: {
21              format: "{%Date}{\"%dd %MMM\"}"
22            },
23            priceLevelNearLabel: {
24              format: "{%LevelValue}{numDecimals:3,trailingZeros:false}"
25            },
26            priceLevelFarLabel: {
27              format: "{%Value}"
28            }
29          }
30        }
31      }
32    ]
33  }
34}

As you can see, you can use common Number and Date Time formatting options. And, of course, you can use all Font configuration options.

See sample chart in the next section to see how formatting, font and visual settings work together.

to top

Visual Settings

Level labels, like any other label, has background with fill and border and font confuguration options, by default labels are formatted like this:

XML/JSON Syntax
Plain code
01 <settings>
02   <price_level_near_label anchor="RightCenter">
03     <background enabled="false">
04       <fill type="Gradient" opacity="0.8">
05         <gradient angle="90">
06           <keys>
07             <key color="#FEFEFE" />
08             <key color="#F1F1F1" />
09           </keys>
10         </gradient>
11       </fill>
12       <border color="#333333" opacity="0.3" />
13       <corners type="Rounded" all="4" />
14       <inside_margin all="2" />
15     </background>
16     <font family="Verdana" bold="false" size="10" align="Center" color="DarkColor(%Color)" render_as_html="false" />
17     <format><![CDATA[{%LevelValue}{numDecimals:3,trailingZeros:false} ({%Value})]]></format>
19   <price_level_far_label anchor="LeftCenter">
20     <background enabled="false">
21       <fill type="Gradient" opacity="0.8">
22         <gradient angle="90">
23           <keys>
24             <key color="#FEFEFE" />
25             <key color="#F1F1F1" />
26           </keys>
27         </gradient>
28       </fill>
29       <border color="#333333" opacity="0.3" />
30       <corners type="Rounded" all="4" />
31       <inside_margin all="2" />
32     </background>
33     <font family="Verdana" bold="false" size="10" align="Center" color="DarkColor(%Color)" render_as_html="false" />
34     <format><![CDATA[{%LevelValue}{numDecimals:3,trailingZeros:false} ({%Value})]]></format>
36   <time_level_near_label anchor="TopCenter">
37     <background enabled="false">
38       <fill type="Gradient" opacity="0.8">
39         <gradient angle="90">
40           <keys>
41             <key color="#FEFEFE" />
42             <key color="#F1F1F1" />
43           </keys>
44         </gradient>
45       </fill>
46       <border color="#333333" opacity="0.3" />
47       <corners type="Rounded" all="4" />
48       <inside_margin all="2" />
49     </background>
50     <font family="Verdana" bold="false" size="10" align="Center" color="DarkColor(%Color)" render_as_html="false" />
51     <format><![CDATA[{%LevelValue}{numDecimals:3,trailingZeros:false}]]></format>
53   <time_level_far_label anchor="BottomCenter">
54     <background enabled="false">
55       <fill type="Gradient" opacity="0.8">
56         <gradient angle="90">
57           <keys>
58             <key color="#FEFEFE" />
59             <key color="#F1F1F1" />
60           </keys>
61         </gradient>
62       </fill>
63       <border color="#333333" opacity="0.3" />
64       <corners type="Rounded" all="4" />
65       <inside_margin all="2" />
66     </background>
67     <font family="Verdana" bold="false" size="10" align="Center" color="DarkColor(%Color)" render_as_html="false" />
68     <format><![CDATA[{%LevelValue}{numDecimals:3,trailingZeros:false}]]></format>
70 </settings>
01{
03    anchor: "RightCenter",
04    background: {
05      enabled: false,
06      fill: {
07        type: "Gradient",
08        opacity: 0.8,
09        gradient: {
10          angle: 90,
11          keys: [
12            {
13              color: "#FEFEFE"
14            },
15            {
16              color: "#F1F1F1"
17            }
18          ]
19        }
20      },
21      border: {
22        color: "#333333",
23        opacity: 0.3
24      },
25      corners: {
26        type: "Rounded",
27        all: 4
28      },
29      insideMargin: {
30        all: 2
31      }
32    },
33    font: {
34      family: "Verdana",
35      bold: false,
36      size: 10,
37      align: "Center",
38      color: "DarkColor(%Color)",
39      renderAsHtml: false
40    },
41    format: "{%LevelValue}{numDecimals:3,trailingZeros:false} ({%Value})"
42  },
44    anchor: "LeftCenter",
45    background: {
46      enabled: false,
47      fill: {
48        type: "Gradient",
49        opacity: 0.8,
50        gradient: {
51          angle: 90,
52          keys: [
53            {
54              color: "#FEFEFE"
55            },
56            {
57              color: "#F1F1F1"
58            }
59          ]
60        }
61      },
62      border: {
63        color: "#333333",
64        opacity: 0.3
65      },
66      corners: {
67        type: "Rounded",
68        all: 4
69      },
70      insideMargin: {
71        all: 2
72      }
73    },
74    font: {
75      family: "Verdana",
76      bold: false,
77      size: 10,
78      align: "Center",
79      color: "DarkColor(%Color)",
80      renderAsHtml: false
81    },
82    format: "{%LevelValue}{numDecimals:3,trailingZeros:false} ({%Value})"
83  },
85    anchor: "TopCenter",
86    background: {
87      enabled: false,
88      fill: {
89        type: "Gradient",
90        opacity: 0.8,
91        gradient: {
92          angle: 90,
93          keys: [
94            {
95              color: "#FEFEFE"
96            },
97            {
98              color: "#F1F1F1"
99            }
100          ]
101        }
102      },
103      border: {
104        color: "#333333",
105        opacity: 0.3
106      },
107      corners: {
108        type: "Rounded",
109        all: 4
110      },
111      insideMargin: {
112        all: 2
113      }
114    },
115    font: {
116      family: "Verdana",
117      bold: false,
118      size: 10,
119      align: "Center",
120      color: "DarkColor(%Color)",
121      renderAsHtml: false
122    },
123    format: "{%LevelValue}{numDecimals:3,trailingZeros:false}"
124  },
126    anchor: "BottomCenter",
127    background: {
128      enabled: false,
129      fill: {
130        type: "Gradient",
131        opacity: 0.8,
132        gradient: {
133          angle: 90,
134          keys: [
135            {
136              color: "#FEFEFE"
137            },
138            {
139              color: "#F1F1F1"
140            }
141          ]
142        }
143      },
144      border: {
145        color: "#333333",
146        opacity: 0.3
147      },
148      corners: {
149        type: "Rounded",
150        all: 4
151      },
152      insideMargin: {
153        all: 2
154      }
155    },
156    font: {
157      family: "Verdana",
158      bold: false,
159      size: 10,
160      align: "Center",
161      color: "DarkColor(%Color)",
162      renderAsHtml: false
163    },
164    format: "{%LevelValue}{numDecimals:3,trailingZeros:false}"
165  }
166}

You can change these settings for any annotation or all of them, you can change the look of the label in some state, you can even change the labels behavior for the given levels. Please take a look at the sample below: defaults section and labels visual settings can completely change the look of annotations:

Live Sample:  Fibonacci Fan Annotation - Levels Labels Visual Settings

to top