Connectors on a Map
Overview
AnyChart allows you to add any number of custom connectors to a map, using them you can show routes, roads, rivers or custom borders.
The lines are almost the same object as lines, the only difference is that connector behaves as a single object and line is a series of points/markers connected with a line.
Use connectors if you want to draw a river, a road or a flight route, use line if you want to show some way with stops (stations), for example transportation plan where each point is an intermediate warehouse.
Note, that you can define actions to be performed on connector click (just the same way as for chart elements ) or handle events in JavaScript and get the moment when connector is selected (you should track a series name to identify it).
Connectors can be drawn by points latitude and longitude coordinates or by the regions centers of the given map. Please refer to Points/Markers Positioning for detailed description of setting points coordinates.

Adding connector
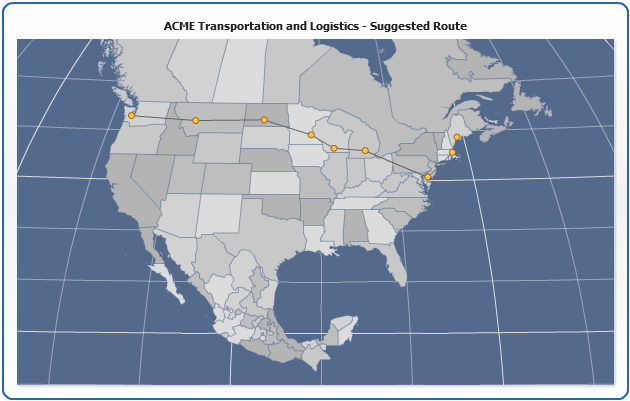
In the sample below we will show a map of the USA, Canada and Mexico, with a sample transportation route from Olympia (WA) to Augusta (ME).
Each city will be marked using marker series, see Points/Markers Tutorial for more.
To add connector to a map we need to create <series> of the Connector type to <data> section, just like that:
02 |
<series name="Olympia - Augusta" type="Connector"> |
03 |
<point x="-92.19" y="38.571" /> |
04 |
<point x="-112.071" y="33.542" /> |
As you can see we've just added two points (in real sample we will add more) into the series of connector type, this connector will behave as
a single line - you can setup tooltip to be shown when user moves the mouse over it.
To add some information about the connector we will add custom data attribute to <series> and later use
this attribute value in tooltip. Sample <series> settings can look like that:
01 |
<series name="Olimpia - Augusta" type="Connector"> |
03 |
<attribute name="cost"><![CDATA[2109.0]]></attribute> |
05 |
<point x="-92.19" y="38.571" /> |
06 |
<point x="-112.071" y="33.542" /> |
Now we configure tooltips in <connector_series>:
02 |
<tooltip_settings enabled="true"> |
03 |
<font render_as_html="true" /> |
04 |
<format><![CDATA[%cbegin<u>{%SeriesName}</u>]<br><b>Cost:</b>{%cost}<br><b>Duration:</b> {%cost}%cend]]></format> |
Now we are ready - add connector configuration and connector series to the map data plot with amap
file ("north_america\usa_canada_and_mexico.amap") set as map source, move the mouse over connector to see how it will be highlighted and route description will be shown:
Live Sample: Sample USA Canada Mexico with connector map