Interactivity in AnyChart
Overview
AnyChart offers you a wide variety of option that allow to make charts really interactive:

Items States
Each element (doesn't matter if this is a column, bar, point or pie slice, or else) in AnyChart Charts has several states, states are changed when user interacts with a chart.
States List
| State |
Description |
| normal |
Normal state defines how an element is displayed by default. |
| hover |
Hover state defines how an element is displayed when user moves mouse cursor over the element, in this state a tooltip is shown (if tooltip is enabled). |
| selected_normal |
Selected state defines how an element is displayed after user clicked it. |
| selected_hover |
SelectedHover state defines how an element is displayed when it is already selected and user moves mouse cursor over it. |
| pushed |
Pushed state defines how an element is displayed when user clicks an element and doesn't release a mouse button. |
| missing |
Special state used to define how to display elements with no value supplied, but interpolated by AnyChart. |
You can describe states in style of the certain chart type or in its series settings, for example these are settings for column or bar chart that define that elements should change the color of the fill:
05 |
<fill type="Solid" color="%Color" /> |
08 |
<fill type="Solid" color="Red" /> |
11 |
<fill type="Solid" color="Black" /> |
12 |
<hatch_fill enabled="true" /> |
13 |
<border enabled="true" color="Black" /> |
16 |
<fill type="Solid" color="Red" /> |
19 |
<fill type="Solid" color="Grey" /> |
23 |
<hatch_fill enabled="false" /> |
24 |
<border enabled="false" /> |
25 |
<effects enabled="false" /> |
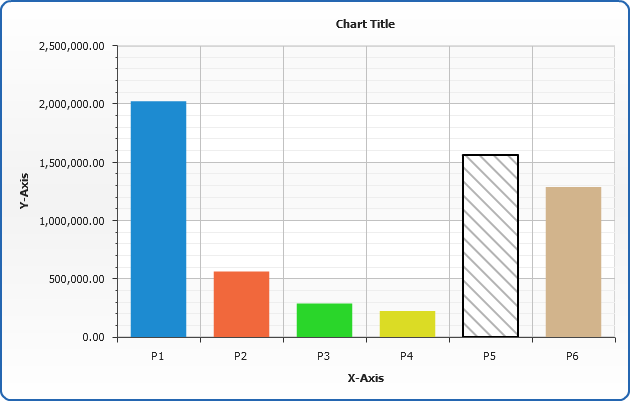
Sample chart with states settings given above:
Live Sample: Interactivity - States Configuration Sample
How to disable select feature
If you don't want certain states to be selectable - use <interactivity selectable="false"> node or allow_select="false" in <point> :
To disable select feature for the chart:
02 |
<interactivity allow_select="false" /> |
To disable select feature for the given chart type:
02 |
<interactivity allow_select="false" /> |
To disable select feature for the given series:
01 |
<series allow_select="false" /> |
To disable select feature for the given point:
01 |
<point allow_select="false" /> |
On the states sample chart above the "P6" point can not be selected.
Element Selected by Default
If you want some point to be displayed as selected upon chart rendering, as if user already clicked it - use selected="true" attribute of a <point> node:
01 |
<point name="Name" y="10" selected="true" /> |
On the states sample chart above the "P5" point is selected by default.
Note: External States Change Handling
You can handle the changes of the states in an external environment - see Events Dispatched by AnyChart for more.
Items Actions
You can define one or several actions be performed when user clicks a point on the chart, typical
action settings for point looks like show below, it will open a page with parameters passed in URL:
01 |
<point name="P1" y="10"> |
03 |
<action type="navigateToURL" url="http://www.anychart.com/?param={%Name}" target="_blank" /> |
There are several types of actions:
| Type |
Description |
| navigateToURL |
Used to open certain web page, may be used to call JavaScript functions. |
| call |
Used to call for external functions, may be used to call JavaScript functions. |
| updateChart |
Used to update the current chart data. |
| updateView |
Used to update a certain view in dashboard mode. |
navigateToURL
navigateToURL action allows you to open a web page or launch a JavaScript (however call action is more preferable to launch external functions), url attribute specifies an address, target - a target for the page:
01 |
<point name="P1" y="10"> |
03 |
<action type="navigateToURL" url="http://www.anychart.com/" target="_blank" /> |
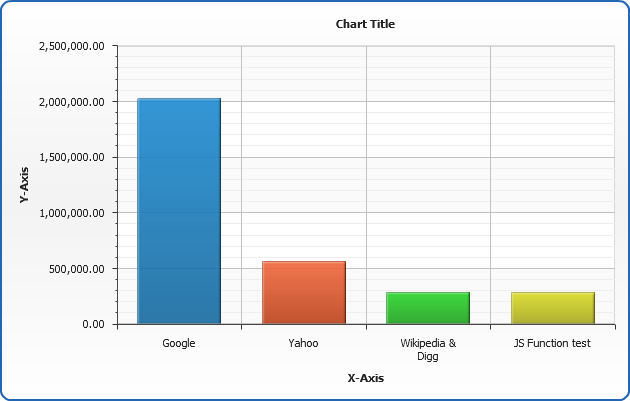
This sample chart will open Google and Yahoo pages in new window, Digg and Wikipedia will be opened at once
and the last column click will lead to JavaScript function call:
Live Sample: Interactivity - opening web page on point click
call
call action type is used to launch a function in an external environment - this can be
JavaScript, or .Net, or Flash - any environment that can interact with Flash Movie.
You should specify the name of a function and arguments values (if any):
01 |
<point name="P1" y="10"> |
03 |
<action type="call" function="alert"> |
04 |
<arg><![CDATA[Test Alert Function]]></arg> |
This sample launches"Alert" function with different parameters on three first columns
and opens AnyChart.Com site in a new window using "window.open" function:
Live Sample: Interactivity - functions call
updateChart
updateChart is used to update chart from an external or internal source.
This action can be used to create drill-down charts.
Advanced options of updateChart are described in Advanced updateView and updateChart Actions article.
You have to specify if the source is external, or internal and specify
the name of the chart within <charts> node in the current XML, or an URL of XML file (or script), that return XML with <chart> node with chart data:
01 |
<point name="P1" y="10"> |
03 |
<action type="updateChart" source_mode="internalData" source="DrillDown" /> |
In this sample we will use internal source - two chart will show each other upon point clicks:
Live Sample: Interactivity - self update
updateView
updateView is used to update a part of dashboard when dashboard mode is used.
Advanced options of updateView are described in Advanced updateView and updateChart Actions article.
You have to set a name of a view that should be updated, choose whether source will be
internal or external and specify the source itself:
01 |
<point name="P1" y="10"> |
03 |
<action type="updateView" view="SecondaryChart" source_mode="externalData" source="Data2.xml" /> |
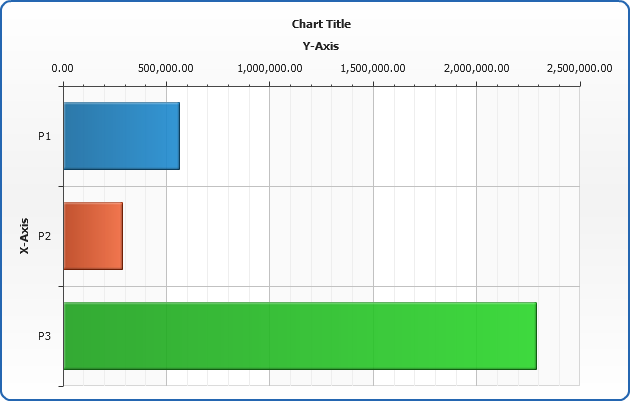
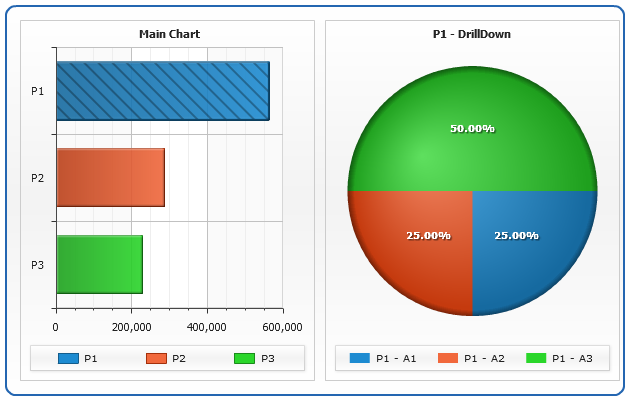
In the sample chart below you can click on the columns on the left and pie chart
to the right will be reloaded:
Live Sample: Interactivity - simple dashboard
Custom Attributes in Actions
In the sample above we've set a certain pages to be opened on point clicks, but for real world applications it is very useful to use parametrized actions.
In AnyChart you can attach custom attributes to points and series, that can store any additional data to be used in tooltips, labels, legend and actions. Custom attributes are described in details in Custom Attributes section of Keywords and formatting tutorial.
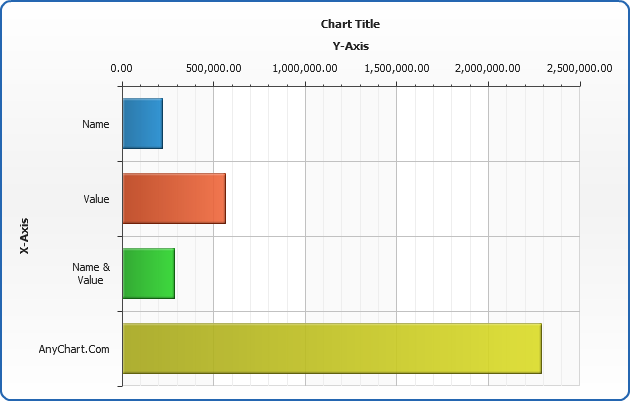
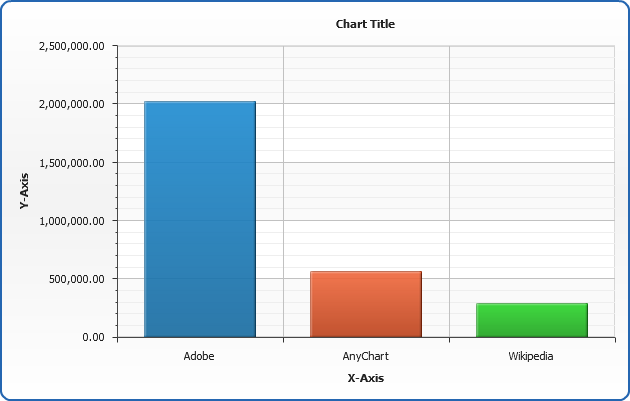
In the sample below we will attach custom attrubutes to points and series and then use them in actions attached to the series (all points in series will perform this action).
Series custom attributes are defined as follows:
03 |
<attribute name="series_keyword"><![CDATA[download]]></attribute> |
Point custom attributes (one point sample) are defined as follows:
01 |
<point name="AnyChart" y="561753"> |
03 |
<attribute name="keywords"><![CDATA[AnyChart Flash Charts Maps Gantt]]></attribute> |
Series action are defined and parametrized as shown below:
03 |
<action type="call" function="alert"> |
04 |
<arg><![CDATA[The following keywords will be queried in Google : {%series_keyword} {%keywords}]]></arg> |
06 |
<action type="navigateToURL" url="http://www.google.com/search?q={%series_keyword}%20{%keywords}" target="_blanc" /> |
Live Sample: Interactivity - custom attributes in actions
You can use this powerfill technique to create your own drill down, interactive charting and/or system. Pass parameters to function or web scripts and perform your application business logic actions according to data passed from charts.
Scrolling and Zooming Actions
If you have scrolling enabled for X or Y axis you can control some scroll and zoom
options using AnyChart actions:
| Action Type |
Description |
| scroll |
Scroll to the given position. |
| zoom |
Zooms to the given range. |
| scrollView |
Scroll the chart in another view to the given position. |
| zoomView |
Zoom the chart in another view to the given range. |
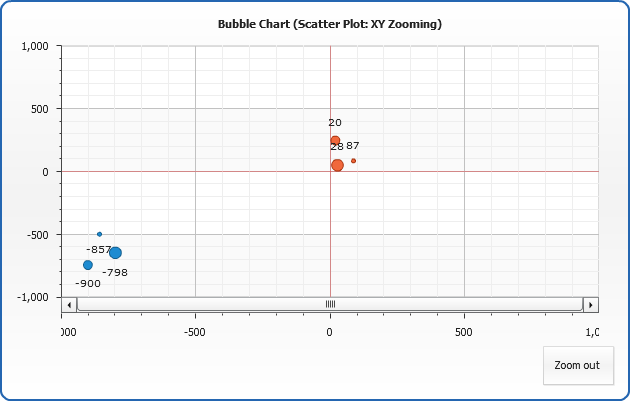
In the sample below scatter plot is created and it has several series in different parts of the plot. Clicking on any series will zoom chart to this series only.
XML set for the series is:
02 |
<action type="zoom" x_start="-1000" x_end="-600" /> |
Launch the live sample and try to click any point - chart will zoom to the series. Show all button also uses actions to show all chart:
Live Sample: Interactivity - zoom and scroll actions
Events
When user interacts with a chart AnyChart dispatches events that can be handled in an external environment (JavaScript, for example). This events supply to external environment all available data about chart and a point, so it is possible to implement a complex business logic, based on the data supplied.
Point related events list:
| Event |
Description |
| pointClick |
Dispatched when user clicks an element - no matter if it is selectable or not. Event returns all available data about point, series and chart. |
| pointMouseOver |
Dispatched when user moves mouse cursor over an element. Event returns all available data about point, series and chart. |
| pointMouseOut |
Dispatched when user moves mouse cursor out of an element. Event returns all available data about point, series and chart. |
| pointSelect |
Dispatched when user selects element (element should be selectable). Event returns all available data about point, series and chart. |
| pointDeselect |
Dispatched when user clicks selected element. Event returns all available data about point, series and chart. |
Sample handling and a reference of data available on events dispatch can be found here:
Java Script Events Handlers
-
AnyChart External Functions
You can set XML to AnyChart from an external environment (JavaScript, for example) there are two functions that allow you do do that: setXMLFile and setData.
Function setData(xmlData) sets chart configuration XML from xmlData .
Sample usage:
Function setXMLFile(xmlPath) sets the path to file with AnyChart XML.
Sample usage: