Advanced updateView and updateChart Actions
Overview
AnyChart offers you a wide variety of option that allow to make charts and dashboard really interactive, one of this features - actions.
There is an option of updateChart and updateView actions, which is named token replacing. Using it requires full understanding of AnyChart XML templates and dashboards, but as a result of this understanding you can create interactive dashboards that receive all data in XML and all the rest (updating and interaction) is configured and performed with AnyChart XML settings.
In this article we will explain what is token replacing and demonstrate how it can be used.

Description
You can define one or several actions be performed when user clicks a point on the chart or custom label control.
We are interested in two types of actions:
| Type |
Description |
| updateChart |
Used to update the current chart data. |
| updateView |
Used to update a certain view in dashboard mode. |
Typical usage of this actions is updating current chart or chart in another dashboard:
01 |
<point name="P1" y="10"> |
03 |
<action type="updateChart" source_mode="internalData" source="DrillDown" /> |
04 |
<action type="updateView" view="SecondaryChart" source_mode="externalData" source="Data2.xml" /> |
But both updateChart and updateView actions can have several
<replace> nodes in them, typical settings:
01 |
<action type="updateChart" view="chartView" source_mode="internalData" source="sourceChart"> |
02 |
<replace token="{$param}"><![CDATA[{%param}]]></replace> |
03 |
<replace token="{$title}"><![CDATA[sample title]]></replace> |
What <replace> node does?
When it is specified updateChart or updateView action will search for token in source and replace this token by the value ("sample title" or value supplied by {%param} keyword in the sample above).
What we can do using tokens?
We can prepare XML settings for chart where some parts of XML (attribute values or even parts of XML) are not specified in full - there are only tokens instead of them.
What results exactly can be achieved using tokens?
- We can once output an XML that will allow to switch chart type on client side with no JavaScript involved.
- We can configure several maps without creation of the number of XML settings files for each of them.
- We can create drill-down charts and maps to create amazing dashboards executed on client side only.
Below several samples of tokens usage will be shown.
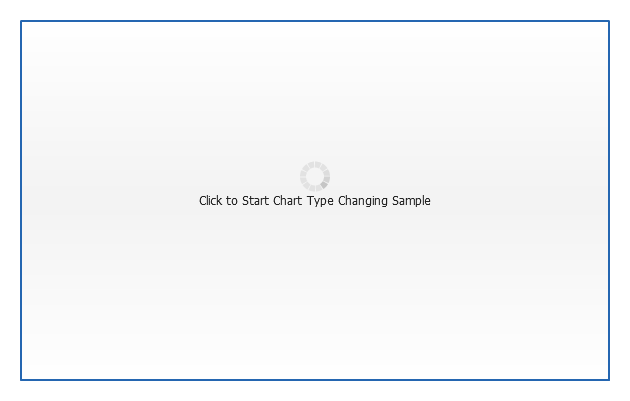
Sample Chart Type Switching
Type Switching sample will use tokens to change plot_type attribute of <chart> node and type attribute of <series> node. Note that when you see "Click to start..." message it is actually a "no data" message configured within XML.
Chart XML with tokens look like that:
01 |
<chart name="ChartTokenized" template="ChartTemplate" plot_type="{$plot}"> |
03 |
<series name="Year 2003" type="{$type}"> |
04 |
<point name="1991" y="41" /> |
05 |
<point name="1992" y="12" /> |
06 |
<point name="1993" y="17" /> |
07 |
<point name="1994" y="6" /> |
08 |
<point name="1995" y="7" /> |
09 |
<point name="1996" y="5.5" /> |
10 |
<point name="1997" y="5" /> |
11 |
<point name="1998" y="3" /> |
12 |
<point name="1999" y="4.5" /> |
13 |
<point name="2000" y="4" /> |
Only data and type are configured here, all other chart parameters are configured in ChartTemplate template in <templates> node.
Sample XML for actions in labels looks like that:
02 |
<action type="updateChart" source_mode="internalData" source="ChartTokenized"> |
03 |
<replace token="{$plot}"><![CDATA[CategorizedVertical]]></replace> |
04 |
<replace token="{$type}"><![CDATA[Line]]></replace> |
Launch the live sample and try switching types yourself:
Live Sample: Advanced Actions Sample Interactive Labels
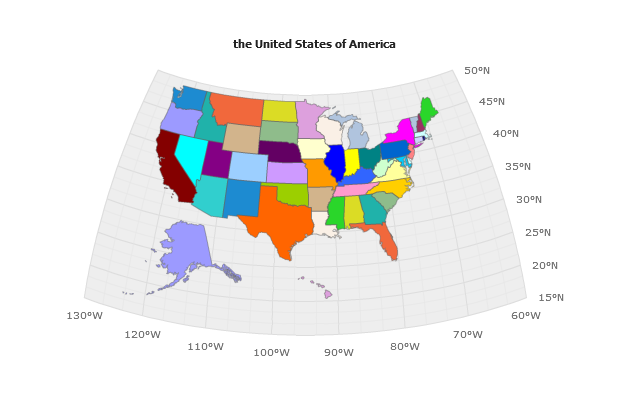
Sample Map Source Switching
In this sample we will use an updateChart action -
replace token option, the action defined like that:
01 |
<action type="updateChart" view="State" source_mode="internalData" source="State"> |
02 |
<replace token="{$region_amap}"><![CDATA[{%REGION_ID}]]></replace> |
03 |
<replace token="{$title}"><![CDATA[{%REGION_NAME}]]></replace> |
Which means that AnyChart will take "State" chart XML and replace
{$region_amap} and {$title} tokens by {%REGION_ID} and {%REGION_NAME} keywords values,
which allows us to create drill-down map for all USA with a rather easy and compact
settings (you can view them in live sample XML preview), also note that we are using
updateChart action to create "Back" button.
State map XML has tokens built-in:
01 |
<chart plot_type="Map" name="State"> |
04 |
<text><![CDATA[{$title}]]></text> |
06 |
<chart_background enabled="false" /> |
07 |
<data_plot_background enabled="false" /> |
08 |
<footer enabled="true"> |
09 |
<text><![CDATA[Back to USA Map]]></text> |
11 |
<action type="updateChart" source_mode="internalData" source="USA" /> |
16 |
<map_series source="usa/states/counties/{$region_amap}.amap"> |
17 |
<projection type="orthographic" /> |
18 |
<undefined_map_region palette="Default"> |
19 |
<tooltip_settings enabled="true"> |
20 |
<format><![CDATA[{%REGION_NAME}]]></format> |
22 |
</undefined_map_region> |
Click on any state to see its counties:
Live Sample: Advanced Actions Sample USA with States updateChart Drilldown Sample
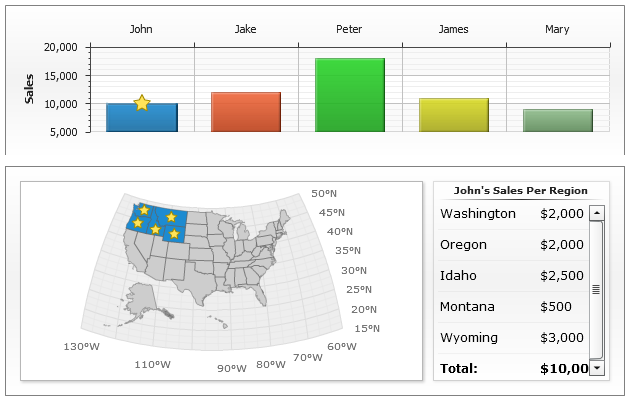
Changing Data
The sample below shows an ability to show certain geo-related data on chart elements clicks,
we will display a column chart that will show a sales amount by managers, and when user will click on the certain column - map will show in which regions this manager works and what are the sales amounts in certain regions.
Action XML Settings for updateView actions:
02 |
<action type="updateView" view="Country" source_mode="internalData" source="USA"> |
03 |
<replace token="{$Name}"><![CDATA[{%Name}]]></replace> |
04 |
<replace token="{$data}"><![CDATA[{%data}{enabled:False}]]></replace> |
05 |
<replace token="{$Color}"><![CDATA[{%Color}]]></replace> |
USA map settings XML has tokens built in like that:
02 |
<series color="{$Color}" type="MapRegions" name="Details"><![CDATA[ |
Each point in Column chart has data in custom attribute:
01 |
<point name="John" y="10000" selected="true"> |
03 |
<attribute name="data"><![CDATA[%cbegin |
04 |
<point y="2000" name="WA"/> |
05 |
<point y="2000" name="OR"/> |
06 |
<point y="2500" name="ID"/> |
07 |
<point y="500" name="MT"/> |
08 |
<point y="3000" name="WY"/>%cend]]></attribute> |
As a result we get a dashboard that allows us to drilldown to see certain manager sales by
region with a single XML file configuration:
Live Sample: Advanced Actions USA Sales Details Dashboard