Chart Templates Tutorial
- Overview
- Templates Explained
- How to create template
- How to apply Template
- Templates Use in Dashboard Mode
- Templates to modify Series Node
Overview
To simplify the creation of chart AnyChart provides "Chart Templates" technique. Chart template is a named preset for any of the chart settings (except certain points settings). Templates can be stored within char XML and in an external file.
In this tutorial we will explain what templates can be used for and how they can be used.
![]()
Templates Explained
The main idea of templates is to segregate chart settings and data section for easy changing and/or reuse in another charts that should look the same way.
For example you can create a template that defines that chart should be of column type, has a certain title, certain axes titles and scales. This type of chart will be widely used on your site, so you just store it in some xml file and when you need such chart you just specify what template should be used - you don't need to configure chart again an copy-paste settings from one place to another.
Another example of templates use - you can create several templates that configure different chart look (colors, border, etc.), store them in a single place and then you can choose how chart should look like (depending on users choice, for example).
![]()
How to create template
The best way to create a template is first to create a desired chart, then choose what parts of its settings should be included into template and then - move them there.
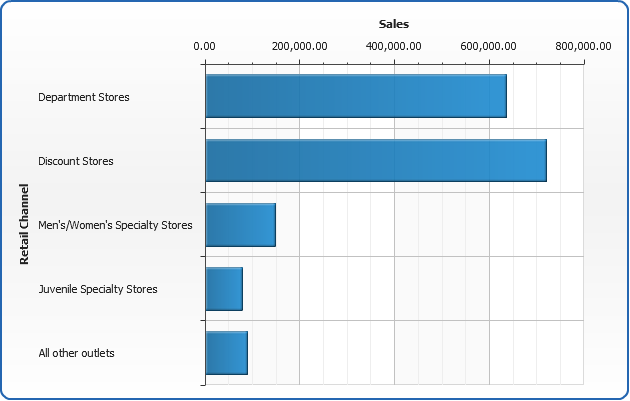
For example, you've took a sample Bar Chart from Bar Chart Tutorial, its XML look like that:

01 |
<?xml version="1.0" encoding="UTF-8"?> |
02 |
<anychart> |
03 |
<charts> |
04 |
<chart plot_type="CategorizedHorizontal"> |
05 |
<data> |
06 |
<series name="Year 2003" type="Bar"> |
07 |
<point name="Department Stores" y="637166" /> |
08 |
<point name="Discount Stores" y="721630" /> |
09 |
<point name="Men's/Women's Specialty Stores" y="148662" /> |
10 |
<point name="Juvenile Specialty Stores" y="78662" /> |
11 |
<point name="All other outlets" y="90000" /> |
12 |
</series> |
13 |
</data> |
14 |
<chart_settings> |
15 |
<title enabled="false" /> |
16 |
<axes> |
17 |
<y_axis> |
18 |
<title> |
19 |
<text><![CDATA[Sales]]></text> |
20 |
</title> |
21 |
</y_axis> |
22 |
<x_axis> |
23 |
<labels align="Outside" /> |
24 |
<title> |
25 |
<text><![CDATA[Retail Channel]]></text> |
26 |
</title> |
27 |
</x_axis> |
28 |
</axes> |
29 |
</chart_settings> |
30 |
</chart> |
31 |
</charts> |
32 |
</anychart> |
Suppose you will create such charts many times, and all of them will have the same axes titles, will have no chart title and they should be of bar type, so you want to move to the template these settings:
01 |
<chart plot_type="CategorizedHorizontal"> |
02 |
<chart_settings> |
03 |
<title enabled="false" /> |
04 |
<axes> |
05 |
<y_axis> |
06 |
<title> |
07 |
<text><![CDATA[Sales]]></text> |
08 |
</title> |
09 |
</y_axis> |
10 |
<x_axis> |
11 |
<labels align="Outside" /> |
12 |
<title> |
13 |
<text><![CDATA[Retail Channel]]></text> |
14 |
</title> |
15 |
</x_axis> |
16 |
</axes> |
17 |
</chart_settings> |
18 |
</chart> |
So, the template should look like that (we will name it "Bar Chart With No Title #1"):
01 |
<template name="Bar Chart With No Title #1"> |
02 |
<chart plot_type="CategorizedHorizontal"> |
03 |
<chart_settings> |
04 |
<title enabled="false" /> |
05 |
<axes> |
06 |
<y_axis> |
07 |
<title> |
08 |
<text><![CDATA[Sales]]></text> |
09 |
</title> |
10 |
</y_axis> |
11 |
<x_axis> |
12 |
<labels align="Outside" /> |
13 |
<title> |
14 |
<text><![CDATA[Retail Channel]]></text> |
15 |
</title> |
16 |
</x_axis> |
17 |
</axes> |
18 |
</chart_settings> |
19 |
</chart> |
20 |
</template> |
Now, when template is ready we will learn where we can store them and how to apply them.
![]()
Internal Templates
You can store you templates within chart XML, in <templates> subnode of <anychart> node:
01 |
<?xml version="1.0" encoding="UTF-8"?> |
02 |
<anychart> |
03 |
<templates> |
04 |
<template name="No Title #1"> |
05 |
<chart plot_type="CategorizedHorizontal"> |
06 |
<chart_settings> |
07 |
<title enabled="false" /> |
08 |
</chart_settings> |
09 |
</chart> |
10 |
</template> |
11 |
</templates> |
12 |
<charts /> |
13 |
</anychart> |
Sample chart using internal template, click to view live sample and XML settings:
![]()
External Templates
Next, you can create a file with templates and attach it to the certain chart XML's.
In templates files root node will be <templates>:
01 |
<templates> |
02 |
<template name="No Title #1"> |
03 |
<chart plot_type="CategorizedHorizontal"> |
04 |
<chart_settings> |
05 |
<title enabled="false" /> |
06 |
</chart_settings> |
07 |
</chart> |
08 |
</template> |
09 |
</templates> |
Sample chart using external template, click to view live sample and XML settings:

![]()
How to apply Template
If you want to apply template to the chart all you have to do is to set its name in template attribute of <chart> node:
01 |
<?xml version="1.0" encoding="UTF-8"?> |
02 |
<anychart> |
03 |
<charts> |
04 |
<chart template="Bar Chart With No Title #1"> |
05 |
<data> |
06 |
<series name="Year 2003" type="Bar"> |
07 |
<point name="Department Stores" y="637166" /> |
08 |
<point name="Discount Stores" y="721630" /> |
09 |
<point name="Men's/Women's Specialty Stores" y="148662" /> |
10 |
<point name="Juvenile Specialty Stores" y="78662" /> |
11 |
<point name="All other outlets" y="90000" /> |
12 |
</series> |
13 |
</data> |
14 |
</chart> |
15 |
</charts> |
16 |
</anychart> |
Internal Templates: if template is specified within an XML file in <templates> node - you just specify a name:
01 |
<?xml version="1.0" encoding="UTF-8"?> |
02 |
<anychart> |
03 |
<templates> |
04 |
<template name="No Title #1"> |
05 |
<chart plot_type="CategorizedHorizontal"> |
06 |
<chart_settings> |
07 |
<title enabled="false" /> |
08 |
</chart_settings> |
09 |
</chart> |
10 |
</template> |
11 |
</templates> |
12 |
<charts> |
13 |
<chart template="No Title #1"> |
14 |
<data> |
15 |
<series name="Year 2003" type="Bar"> |
16 |
<point name="Department Stores" y="637166" /> |
17 |
<point name="Discount Stores" y="721630" /> |
18 |
<point name="Men's/Women's Specialty Stores" y="148662" /> |
19 |
<point name="Juvenile Specialty Stores" y="78662" /> |
20 |
<point name="All other outlets" y="90000" /> |
21 |
</series> |
22 |
</data> |
23 |
</chart> |
24 |
</charts> |
25 |
</anychart> |
External Templates: if template is specified in an external XML file - you should set its name (with path, if needed)in path attribute of <templates> node:
01 |
<?xml version="1.0" encoding="UTF-8"?> |
02 |
<anychart> |
03 |
<templates path="templates.xml" /> |
04 |
<charts> |
05 |
<chart template="No Title #1"> |
06 |
<data> |
07 |
<series name="Year 2003" type="Bar"> |
08 |
<point name="Department Stores" y="637166" /> |
09 |
<point name="Discount Stores" y="721630" /> |
10 |
<point name="Men's/Women's Specialty Stores" y="148662" /> |
11 |
<point name="Juvenile Specialty Stores" y="78662" /> |
12 |
<point name="All other outlets" y="90000" /> |
13 |
</series> |
14 |
</data> |
15 |
</chart> |
16 |
</charts> |
17 |
</anychart> |
![]()
Templates Use in Dashboard Mode
Important note about dashboard mode: all templates for all the charts in dashboard mode will be taken from the path specified in <templates path=""> in a file where dashboard is defined, all paths from chart source files will be ignored.
You can find a sample of templates usage in dashboards in Dashboard Creation Tutorial.
Templates to modify Series Node
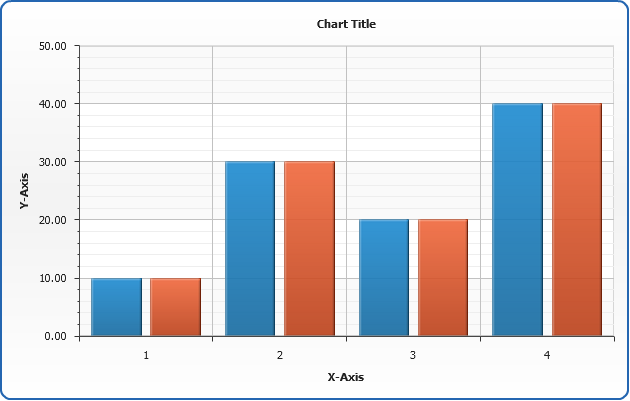
You can change certina series setting using templates if you set the same name of the series both in chart and template.
In the sample below chart contain two series: Test1 and Test2, by default they are colored in different colors from the palette and attached to main y axis:
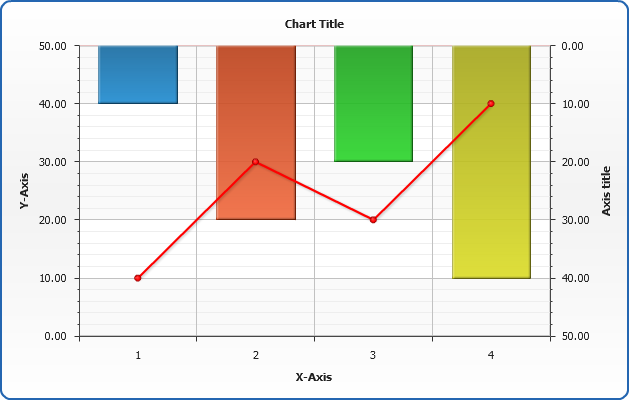
Now we create template that changes the type and attaches Test2 series to extra y axis:
01 |
<templates> |
02 |
<template name="myTemplate"> |
03 |
<chart> |
04 |
<data> |
05 |
<series name="Test1" type="Line" color="Red" /> |
06 |
<series name="Test2" y_axis="y2" palette="Default" /> |
07 |
</data> |
08 |
<chart_settings> |
09 |
<axes> |
10 |
<extra> |
11 |
<y_axis name="y2" enabled="true"> |
12 |
<scale inverted="true" /> |
13 |
</y_axis> |
14 |
</extra> |
15 |
</axes> |
16 |
</chart_settings> |
17 |
</chart> |
18 |
</template> |
19 |
</templates> |
As the result - series are modified:
![]()