Chart Titles
Overview
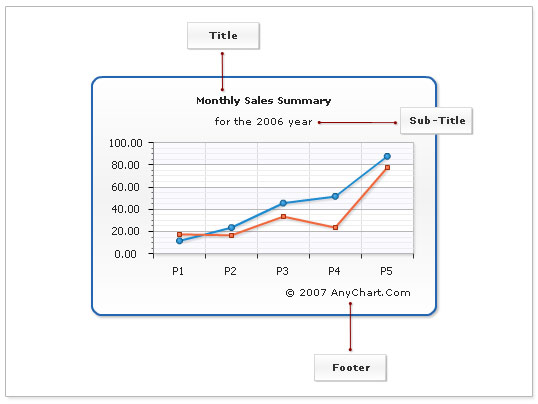
Every chart in AnyChart can have three "titles", they are <title>, <subtitle> and <footer>.
These text fields are used to create description for the chart data. By default, <title> and <subtitle> are placed on the top of the chart, one above another, and <footer> in the bottom right corner.

Enable Titles
To enable chart titles you have to set attribute enabled="True" to any of them:
02 |
<title enabled="True" /> |
03 |
<subtitle enabled="True" /> |
04 |
<footer enabled="True" /> |
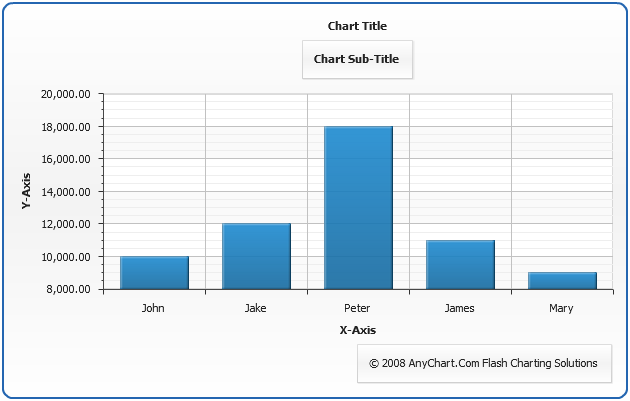
By default dump texts will appear, when you enable titles:
Live Sample: Chart titles enabling Sample
Setting Text
Of course you can specify your own texts for titles, just like that:
02 |
<title enabled="True"> |
03 |
<text><![CDATA[Sales performance]]></text> |
05 |
<subtitle enabled="True"> |
06 |
<text><![CDATA[First Quarter Earnings: {%DataPlotYSum}]]></text> |
08 |
<footer enabled="True"> |
09 |
<text><![CDATA[according to annual report]]></text> |
Here is an example - notice that we've used some keywords ({%DataPlotYSum} to calculate all values-sales total on the plot) to create texts:
Live Sample: Chart titles text Sample
Full reference of available keywords is available in the end of this article: Keywords reference.
General formatting questions are answered in Text Formatting and Keywords section.
Learn how to format keywords in Number Formatting section.
Adding Links to Chart Titles
You can make your chart title, subtitle or footer a clickable link to some page or launch JavaScript function using url and url_target attributes of <title>, <subtitle> or <footer> nodes, for example:
01 |
<title enabled="True" url="http://www.anychart.com" url_target="_blank"> |
02 |
<text><![CDATA[Click to go to AnyChart.Com]]></text> |
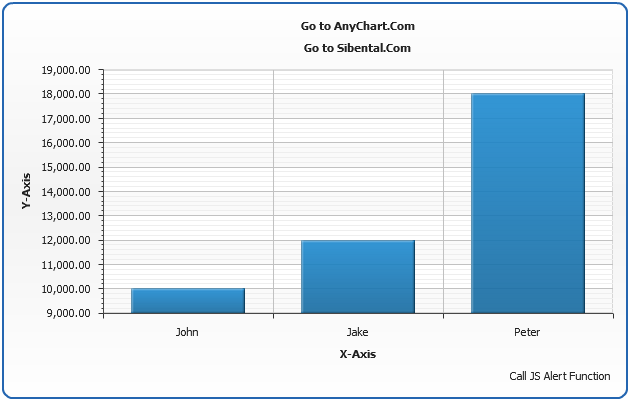
Launch this live sample and try to click on the chart title, subtitle or footer.
Live Sample: Chart titles clickable links
Adding Actions to Chart Titles
You can attach complex actions to chart title, subtitle or footer - this feature allows to use
titles as "Control", for example: refresh chart data or "Back" in drilldown charts.
The action are added just in the same way as they are added to chart points:
03 |
<action type="navigateToURL" url="http://www.anychart.com/" target="_blank" /> |
04 |
<action type="updateChart" source_mode="internalData" source="DrillDown" /> |
Sample Actions 1 - JavaScript Functions
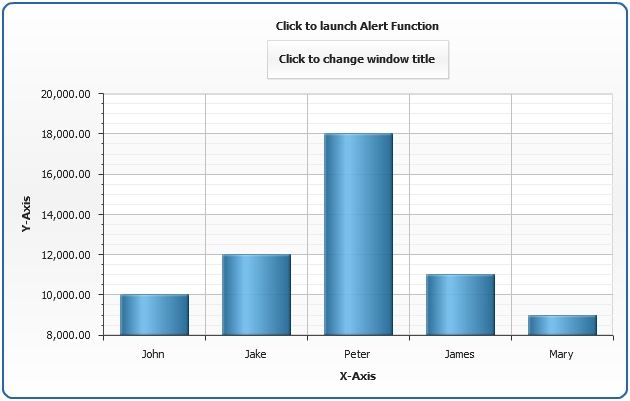
You can add as many actions as you need, the sample below shows how JavaScript functions can be attached
to chart title and chart subtitle. Please note that we can use keywords in action parameters - alert functions shows
a sum of all point on data plot using {%DataPlotYSum}, all available keywords are listed at the end of this article.
Live Sample: Chart title and subtitle actions javascript functions sample
Sample Actions 2 - Drilldown "Back" button
In this sample we will show how chart footer can be used as "Back" button for self-drilldown charts.
Click on bars to see detailed report on each sales manager and in detailed report click on "Back to Sales Manager Report"
button in the bottom right corner of line chart to load initial chart.
Note that data for all chart is stored in one xml - several <chart> nodes with different names are created, and all detailed reports use one "ButtonTemplate" template, that configures "Back" buttom - launch the live sample and view XML settings for details.
Live Sample: Chart title and subtitle actions back button sample
Titles Layout and Padding
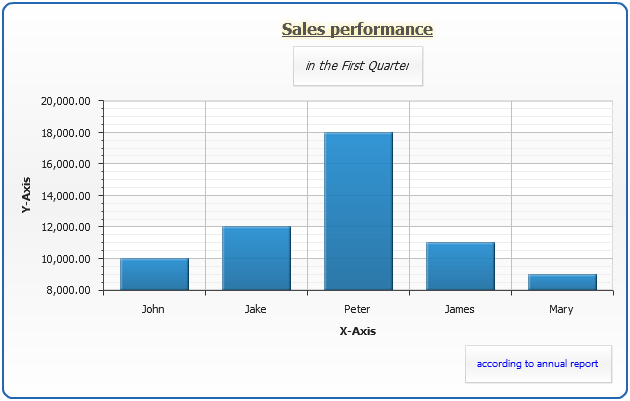
As we've said above, chart title and subtitle are placed to the top by default, but you can place
them anywhere you'd like to, using position and align attributes. You can do the same with footer.
Read more about Controls Layout in Controls and Control Positioning Tutorial.
02 |
<title position="Left" align="Center" align_mode="horizontal" align_by="DataPlot" enabled="True"> |
03 |
<text><![CDATA[Sales performance]]></text> |
05 |
<subtitle position="Left" align="Center" align_mode="horizontal" align_by="DataPlot" enabled="True"> |
06 |
<text><![CDATA[in the First Quarter]]></text> |
08 |
<footer align="Far" align_by="Chart" enabled="True"> |
09 |
<text><![CDATA[according to annual report]]></text> |
The chart with titles configured as shown above will look like:
Live Sample: Chart titles layout Sample
If you want to move title away/closer from/to data plot area - use padding attribute:
02 |
<title enabled="True" padding="50"> |
03 |
<text><![CDATA[Sales performance]]></text> |
05 |
<footer enabled="True" padding="0"> |
06 |
<text><![CDATA[according to annual report]]></text> |
In the sample we moved both title and footer away:
Live Sample: Chart titles paddings Sample
Font Settings
If you don't use HTML in font texts (as described below), you may apply
formatting and effects to whole titles texts:
02 |
<title enabled="True"> |
03 |
<text><![CDATA[Sales performance]]></text> |
04 |
<font bold="True" underline="true" size="16" color="White"> |
06 |
<drop_shadow enabled="true" /> |
10 |
<subtitle enabled="True"> |
11 |
<text><![CDATA[in the First Quarter]]></text> |
12 |
<font italic="True" size="12" /> |
14 |
<footer enabled="True"> |
15 |
<text><![CDATA[according to annual report]]></text> |
16 |
<font color="Blue" size="10" /> |
We've made title bold, underlined, set size to 16 and added a glow effect,
subtitle - italic, size 14 and footer Blue, size 10:
Live Sample: Chart titles font formatting Sample
For more information on font configuration, please refer to Font settings tutorial.
HTML in text
You can use HTML formatted text within chart <text> node, to that you have to enable render_as_html="True" attribute in <font> node ,
you can not apply effects if you are using HTML formatting, and all other settings in <font> node will be ignored.
02 |
<title enabled="True"> |
03 |
<text><![CDATA[%cbegin<u><b><font size="16px" face="Verdana">Sales performance</font></b></u>%cend]]></text> |
04 |
<font render_as_html="True" /> |
06 |
<subtitle enabled="True"> |
07 |
<text><![CDATA[%cbegin<i><font size="12px" face="Verdana">in the First Quarter</font></i>%cend]]></text> |
08 |
<font render_as_html="True" /> |
10 |
<footer enabled="True"> |
11 |
<text><![CDATA[%cbegin<font size="10px" color="#0000FF" face="Verdana">according to annual report</font>%cend]]></text> |
12 |
<font render_as_html="True" /> |
In this sample we will reproduce the formatting from Font Settings section, using HTML formatting, note that HTML formatted text is enclosed in <![CDATA[...]]> section, in order to be able to paste tags and special symbols in XML.
Live Sample: Chart titles HTML text formatting Sample
For more information on font configuration, please refer to Font settings tutorial.
Background Settings
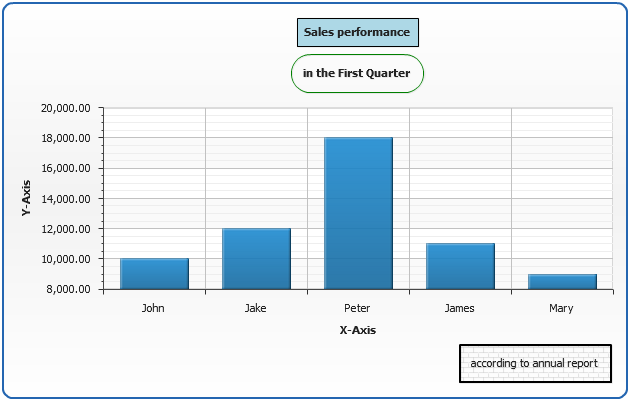
You can configure background for titles, do that you need to add <background> node and set enabled="True", in <background> node you can also configure borders, effects, corners, etc. as described in Background tutorial,
in this section we will quickly demonstrate the use of background with chart titles.
02 |
<title enabled="True"> |
03 |
<text><![CDATA[Sales performance]]></text> |
04 |
<background enabled="True"> |
05 |
<fill enabled="True" type="Solid" color="LightBlue" /> |
06 |
<border enabled="True" type="Solid" color="Black" /> |
09 |
<subtitle enabled="True"> |
10 |
<text><![CDATA[in the First Quarter]]></text> |
11 |
<background enabled="True"> |
12 |
<fill enabled="False" /> |
13 |
<border enabled="True" type="Solid" color="Green" /> |
14 |
<corners all="20" type="Rounded" /> |
17 |
<footer enabled="True"> |
18 |
<text><![CDATA[according to annual report]]></text> |
19 |
<background enabled="True"> |
20 |
<fill enabled="False" /> |
21 |
<hatch_fill opacity="0.1" enabled="True" color="Black" type="HorizontalBrick" /> |
22 |
<border enabled="True" type="Solid" thickness="2" color="Black" /> |
This sample has nothing to do with chart design, but it demonstrates what you can configure
in background:
Live Sample: Chart titles background Sample
Now you know almost everything you need to configure your chart titles, for more information on possible
chart titles configuration please refer to full attribute and node listings in XML Reference.
Keywords Reference
This table list all built-in keywords that can be used in titles formatting.
| Keyword |
Description |
| {%DataPlotYSum} |
The sum of all the points y values. |
| {%DataPlotXSum} |
The sum of all the points x values (Scatter plot charts). |
| {%DataPlotBubbleSizeSum} |
The sum of all the points bubble sizes (Bubble chart). |
| {%DataPlotYMax} |
The maximal of all the points y values. |
| {%DataPlotYMin} |
The minimal of all the points y values. |
| {%DataPlotXMax} |
The maximal of all the points x values (Scatter plot chart). |
| {%DataPlotXMin} |
The minimal of all the points x values (Scatter plot chart). |
| {%DataPlotBubbleMaxSize} |
The maximal of all the points bubble sizes (Bubble chart). |
| {%DataPlotBubbleMinSize} |
The minimal of all the points bubble sizes (Bubble chart). |
| {%DataPlotXAverage} |
The average x value of all the points (Scatter plot charts). |
| {%DataPlotYAverage} |
The average y value of all the points. |
| {%DataPlotBubbleSizeAverage} |
The average bubble size of all the points (Scatter plot charts). |
| {%DataPlotMaxYValuePointName} |
The name of the point with a maximal of all the points y values. |
| {%DataPlotMinYValuePointName} |
The name of the point with a minimal of all the points y values. |
| {%DataPlotMaxYValuePointSeriesName} |
The name of the series with a maximal of all the points y values. |
| {%DataPlotMinYValuePointSeriesName} |
The name of the series with a minimal of all the points y values. |
| {%DataPlotMaxYSumSeriesName} |
The name of the series with a maximal sum of the points y values. |
| {%DataPlotMinYSumSeriesName} |
The name of the series with a minimal sum of the points y values. |
| {%DataPlotYRangeMax} |
The maximal of the ranges of the points within the chart. |
| {%DataPlotYRangeMin} |
The minimal of the ranges of the points within the chart. |
| {%DataPlotYRangeSum} |
The sum of the ranges of the points within the chart. |
| {%DataPlotPointCount} |
The number of the points within the chart. |
| {%DataPlotSeriesCount} |
The number of the series within the chart. |
Y Axis
This table list all built-in keywords that provide Y axis data and y axis-related pre calculated values.
| Keyword |
Description |
| {%YAxisSum} |
The sum of all y values of all points in series that are bound to this axis. |
| {%YAxisBubbleSizeSum} |
The sum of all bubble sizes of all points in series that are bound to this axis. |
| {%YAxisMax} |
The maximal y value of all points in series that are bound to this axis. |
| {%YAxisMin} |
The minimal y value of all points in series that are bound to this axis. |
| {%YAxisScaleMax} |
The maximal scale value. |
| {%YAxisScaleMin} |
The minimal scale value. |
| {%YAxisBubbleSizeMax} |
The maximal bubble size of all points in series that are bound to this axis. |
| {%YAxisBubbleSizeMin} |
The minimal bubble size of all points in series that are bound to this axis. |
| {%YAxisAverage} |
The average y value of all points in series that are bound to this axis. |
| {%YAxisMedian} |
The median y value of all points in series that are bound to this axis. |
| {%YAxisMode} |
The mode y value of all points in series that are bound to this axis. |
| {%YAxisName} |
The name of the axis. |
X Axis
This table list all built-in keywords that provide X axis data and x axis-related precalculated values. Only for Scatter plot charts.
| Keyword |
Description |
| {%XAxisSum} |
The sum of all x values of all points in series. |
| {%XAxisBubbleSizeSum} |
The sum of all bubble sizes of all points in series. |
| {%XAxisMax} |
The maximal x value of all points in series. |
| {%XAxisMin} |
The minimal x value of all points in series. |
| {%XAxisScaleMax} |
The maximal scale value. |
| {%XAxisScaleMin} |
The minimal scale value. |
| {%XAxisBubbleSizeMax} |
The maximal bubble size of all points in series. |
| {%XAxisBubbleSizeMin} |
The minimal bubble size of all points in series. |
| {%XAxisAverage} |
The average x value of all points in series. |
| {%XAxisMedian} |
The median x value of all points in series. |
| {%XAxisMode} |
The mode x value of all points in series. |
| {%XAxisName} |
The name of the axis. |