Number formatting
- Overview
- Formatting parameters
- Changing the decimal separator sign
- Changing the number of decimal digits
- Changing the thousands separator
- Using "(1)" instead of "-1" (Brackets instead of minus sign for negative numbers)
- Setting the number of leading
- Trailing zeros
- Setting maximum of visible characters
- Values scaling
- Samples
Overview
In AnyChart if you have a keyword that returns a numerical value you can format it using formatting postfixes. In the article below all parameters are listed with the usage explanation and sample syntax.
Formatting parameters
All formatting parameters for keyword are specified in a following way: {%KeywordName}{Param:value} or, if you need to specify several parameters: {%KeywordName}{Param1:Value1,Param2:Value2}, note that all keywords, parameters and parameter values are case-sensitive.
If you want to use these symbols ":", "{", "}" , "," in parameter format use "\:", "\{", "\}" , "\," instead.
By default all number keywords are formatted, to disable formatting use {%KeywordName}{enabled:False}
![]()
Changing the decimal separator sign
The decimal separator is a symbol used to mark the boundary between the integer and the fractional parts of a decimal numeral. You can change the decimal separator to the symbol common in your country or industry using decimalSeparator parameter. The default decimal separator in AnyChart is dot: "."
Sample changing decimal separator to coma: ","

01 |
<text><![CDATA[{%Value}{decimalSeparator:,}]]></text> |
![]()
Changing the number of decimal digits
The number of digits to be shown after the decimal separator is controlled using numDecimals parameter, all digits are simple truncated - not rounded.
Sample changing the number of decimal digits to 3.
01 |
<text><![CDATA[{%Value}{numDecimals:3}]]></text> |
![]()
Changing the thousands separator
Numbers with many digits before the decimal separator may be divided into groups of three, starting from the decimal separator to the left. The symbol for this is called the thousands separator or digit group separator. If the decimal separator is a point, the thousands separator is often a comma or a space. To change the thousands separator use thousandsSeparator parameter.
Sample changing the thousands separator to space: " ".
01 |
<text><![CDATA[{%Value}{thousandsSeparator: }]]></text> |
![]()
Using Brackets instead of Minus for negative numbers
The common mathematical symbols used to represent the notions of negative numbers is minus sign: "-", if you would you rather have negative amounts on your financial charts indicated with brackets, instead of the minus sign - use useNegativeSign:false
01 |
<text><![CDATA[{%Value}{useNegativeSign:false}]]></text> |
![]()
Setting the number of leading and trailing zeros
A leading zero is any zero that leads a number string with a non-zero value. Leading zeros are also likely to be used by utility billing systems, human resources information systems and government databases. Leading zeros are used to make ascending order of numbers correspond with alphabetical order: e.g. 11 comes alphabetically before 2, but after 02.
The number of leading zeros can be controlled using leadingZeros.
Sample setting the number of leading zeros to 5:
01 |
<text><![CDATA[{%Value}{leadingZeros:5}]]></text> |
![]()
Trailing zeros
In mathematics, trailing zeros are the sequence of zeros in the decimal representation (or more generally, in any positional representation) of a number, after which no other digits follow. Trailing zeros to the right of the decimal point, as in 12.3400, do not affect the value of the number and may be omitted if all that is of interest is its numerical value. This is true even if the zeros recur infinitely. However, trailing zeros may be useful for indicating the number of significant figures, for example in measurement. In such context, "simplifying" the number by removing trailing zeros wouldn't be incorrect.
The special formatting option for showing trailing zeros is trailingZeros, which is boolean; it can be either true or false. By default it is true, and if you want to disable showing trailing zeros, you would have to set it to false explicitly:
01 |
<text><![CDATA[{%Value}{trailingZeros:false}]]></text> |
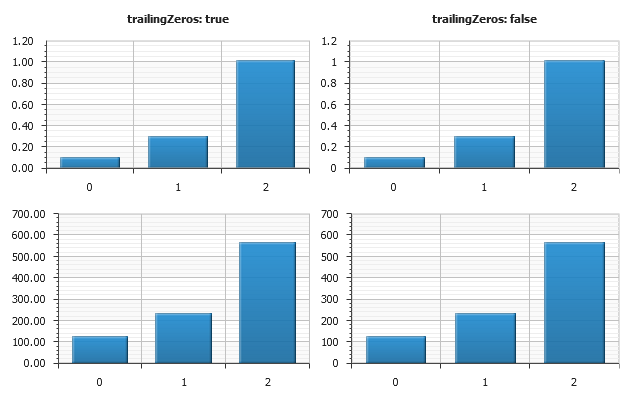
Note: trailingZeros:true makes sense and works in conjunction with the numDecimals parameter.
If the format is set to {%Value}{numDecimals:5,trailingZeros:false} then:
- if {%Value} returns "500" - it is shown as "500"
- if {%Value} returns "1.25" - it is shown as "1.25"
But if the format is set to {%Value}{numDecimals:5,trailingZeros:true} then:
- if {%Value} returns "500" - it is shown as "500.00000"
- if {%Value} returns "1.25" - it is shown as "1.25000"
Live sample below shows how trailingZeros works with numDecimals param in Y-Axis labels formatting:
![]()
Setting maximum of visible characters
If the value (a number or a text) is to large, you may want to limit the number of characters using maxChar keyword. This parameters sets the maximal number of symbols, that are displayed. For example if the length of the string in {%Value} is greater than maxChar, then it will be trimmed and symbols set in maxCharFinalChars (by default "...") are shown at the end (this is done to show explicitly, that string is trimmed). If the number of characters in {%Value} is less than or equal to maxChar, then {%Value} is displayed as is.
If you don't want to show anything when value is trimmed - just set maxCharFinalChars to nothing.
Sample setting maximum of visible characters to 5 and no final characters:
01 |
<text><![CDATA[{%Value}{maxChar:5,maxCharFinalChars:}]]></text> |
![]()
Values scaling
In certain application areas it is very useful to scale values according to some custom user-defined scale. The examples of this can be found almost everywhere: kilobyte has 1024 bytes in it, minute consists of 60 seconds, yard - 3 feet, troy ounce - 480 grains.
AnyChart allows you to set a custom scale for any value using scale parameter.
Sample setting the number scaling according to the common short names of thousands (k), millions (m) and billions (b):
01 |
<text><![CDATA[{%Value}{scale:(1000)(1000)(1000)|(k)(m)(b)}]]></text> |
The result of such scaling will be as shown in the table below:
| Input | Scaled |
|---|---|
| 1000 | 1k |
| 10000 | 10k |
| 1000000 | 1m |
| 1000000000 | 1b |
Another example of scaling: 1 pound consists of 20 shillings, 1 shilling - 12 pence. So we have the following scale:
01 |
<text><![CDATA[{%Value}{scale:(1)(12)(20)|(p)(s)(£)}]]></text> |
And the sample for length/distance units:
1 feet = 12 inches
1 yard = 3 feet
1 mile=1760 yards
01 |
<text><![CDATA[{%Value}{scale:(12)(3)(1760)|(feet)(yards)(miles)}]]></text> |
Formatting Samples
Sample 1 - General Formatting
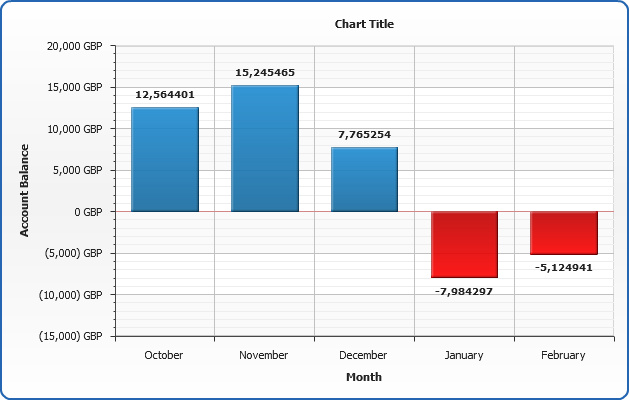
In this sample we will demonstrate all major number formatting parameters applied to keyword formatting in different chart elements, such as point labels and tooltips, axes labels and titles.
Axes labels formatting: for Y axis labels we've set number of decimal digits to zero, changed default thousands separator to coma, specified that brackets will be used instead of minus sign and added "GBP" postfix:
01 |
<y_axis> |
02 |
<title> |
03 |
<text><![CDATA[Account Balance]]></text> |
04 |
</title> |
05 |
<labels> |
06 |
<format><![CDATA[{%Value}{numDecimals:0,useNegativeSign:false,thousandsSeparator:,} GBP]]></format> |
07 |
</labels> |
08 |
</y_axis> |
Point labels formatting: for point labels we've set number of decimal digits to three along with setting number of trailing zeros to three, too, changed default thousands separator to apostrophe and default decimal separator to coma:
01 |
<label_settings enabled="true"> |
02 |
<format><![CDATA[{%YValue}{numDecimals:3,trailingZeros:3,decimalSeparator:,,thousandsSeparator:'}]]></format> |
03 |
</label_settings> |
Point tooltips formatting: for point we've left {%YValue} unformatted, but tuned visual appearance of tooltip a lot. We've used HTML formatted text along with keywords: {%YAxisName} and {%Name} to show y axis title and point name within tooltip text.
01 |
<tooltip_settings enabled="true"> |
02 |
<font render_as_html="true" /> |
03 |
<format><![CDATA[<font size="9" face="Verdana"><b>{%YAxisName}</b> |
04 |
{%Name}: {%YValue} £</font>]]></format> |
05 |
</tooltip_settings> |
![]()
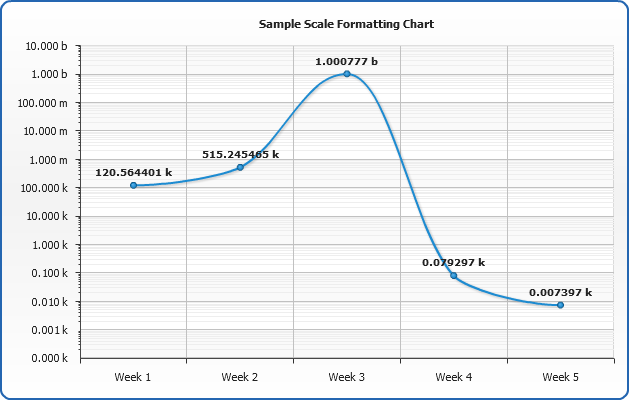
Sample 2 - Using values scaling with logarithmic axis
In this sample we show how values scaling can be used with logarithmic axis scale: as the values on a logarithmic axis vary from very small to very big, it is useful to show number abbreviations instead of showing a number with uncountable zeros.
01 |
<y_axis> |
02 |
<labels align="inside"> |
03 |
<format><![CDATA[{%Value}{numDecimals:3,scale:(1000)(1000)(1000)|( k)( m)( b)} ]]></format> |
04 |
</labels> |
05 |
<scale type="Logarithmic" minimum="0.1" /> |
06 |
</y_axis> |
So, we are using values scaling (k instead of thousands, m instead of millions and b instead of billions) in the axis and point labels, tooltips will show unscaled values:
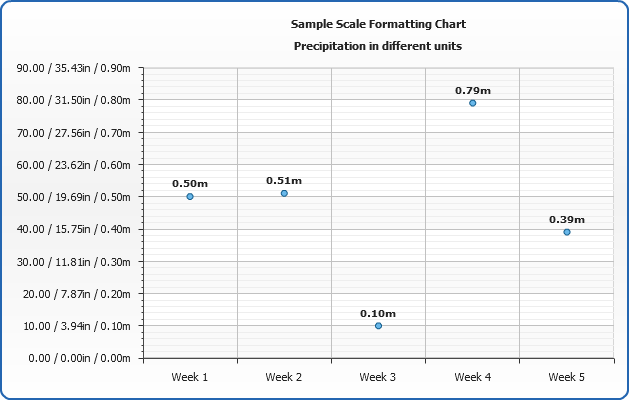
Sample 3 - Using values scaling for showing labels in different units
In this sample we show how values scaling can be used with in axis labels to show value in different units.
01 |
<y_axis> |
02 |
<labels align="inside"> |
03 |
<format><![CDATA[{%Value}/{%Value}{numDecimals:2,scale:(2.54)|(in)}/ {%Value}{numDecimals:2,scale:(0.1)|(in)} ]]></format> |
04 |
</labels> |
05 |
</y_axis> |
So, we are using values scaling to show precipitation level in centimeters, inches and meters in the axis labels, meters in point labels and inches in tooltips:
![]()